
Description
The Jurik smoothing includes 3 stages:
1st stage - preliminary smoothing by adaptive EMA: MA1 = (1-alpha)*Price + alpha*MA1[1];
2nd stage - one more preliminary smoothing by Kalman filter: Det0 = (Price - MA1)*(1-beta) + beta*Det0[1]; MA2 = MA1 + PR*Det0;
3rd stage - final smoothing by unique Jurik adaptive filter: Det1 = (MA2 - JMA[1]) * (1-alpha)^2 + alpha^2 * Det1[1]; JMA = JMA[1] + Det1;
where: - Price - Price Series - alpha - dynamic factor(will be described below) - beta - periodic ratio = 0.45*(Length-1)/(0.45*(Length-1)+2) - PR - Phase Ratio: PR = Phase/100 + 1.5 (if Phase < -100 then PR=0.5, if Phase > 100 then PR=2.5).
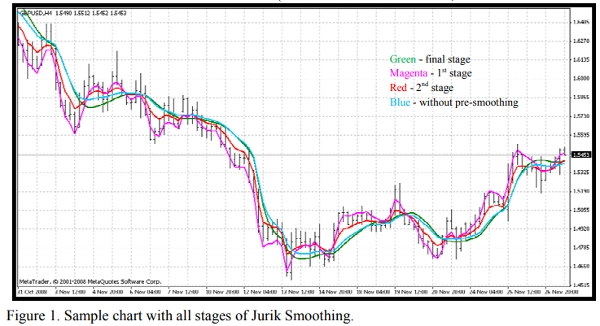
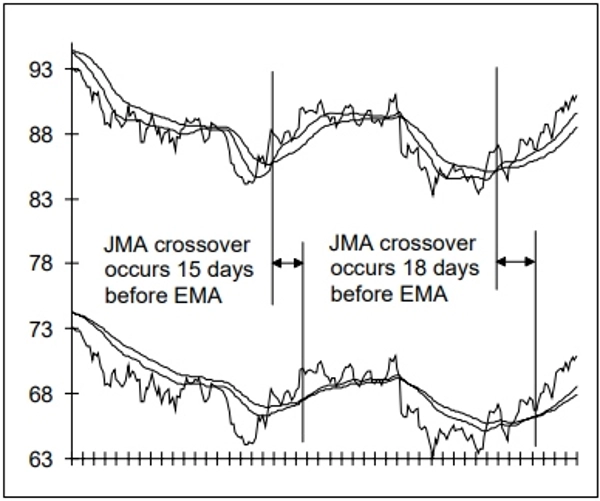
Figure 1. Sample chart with all stages of Jurik Smoothing. You can see results (Figure 1) of each stage by means of attached indicator JurikFilter_v2, changing FilterMode: 0 - final stage(JMA) 1 - 1st stage 2 - 2nd stage 3 - only final(without preliminary) smoothing.
The Dynamic Factor is periodic factor (beta) raised to a power (pow):
alpha = beta ^ Pow,
where: - pow = rVolty ^ pow1 - rVolty - relative price volatility - pow1 - power of relative volatility with following formula: pow1 = len1 - 2 (if pow1 < 0.5 then pow1 = 0.5),
where len1 - additional periodic factor: len1 = Log(SquareRoot(len))/Log(2.0) + 2 (if len1 < 0 then len1 = 0).
Thus you can see that the Dynamic factor is based on the relative price volatility giving the required adaptability for this kind of the price filter.
The formula for relative price volatility is rVolty = Volty/AvgVolty (if rVolty > len1^(1/pow1) then rVolty = len1^(1/pow1), if rVolty < 1 then rVolty = 1),
where:
- Volty - price volatility based on calculation of so-called Jurik Bands (VisualMode = 1).
- AvgVolty - average volatility for which Jurik use difficult enough algorithm of calculation: AvgVolty = Average(vSum,AvgLen),
where:
- vSum - incremental sum of (Volty - Volty[10])/10;
- AvgLen - period of average (Jurik use 65).
In my version of Jurik Filter I use simple average instead of Jurik's complex averaging
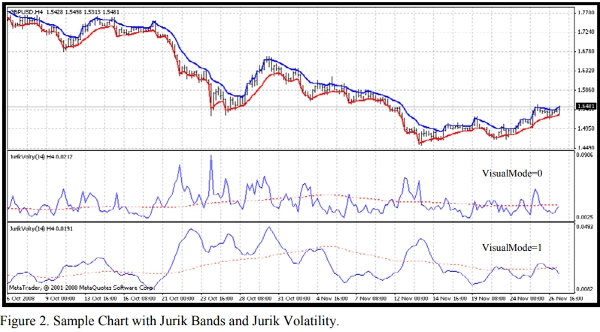
Moreover, with attached indicator JurikVolty_v1(Figure 2) you can see values for Volty (VisualMode=0), vSum (VisualMode=1) and AvgVolty(red dotted line).
The formula for price volatility is Volty = max between Abs(del1) and Abs(del2), if Abs(del1) = Abs(del2) then Volty = 0,
where: - del1 - distance between price and upper band del1 = Price - UpperBand - del2 - distance between price and lower band del2 = Price - LowerBand The Jurik Bands are different from any known price bands such as Bollinger, Keltner, Donchian, Fractal and so on: if del1 > 0 then UpperBand = Price else UpperBand = Price - Kv*del1 if del2 < 0 then LowerBand = Price else LowerBand = Price - Kv*del2,
where: - Kv - volatility's factor Kv = bet ^ SquareRoot(pow2). It's easy to see that these bands can be a basis for trend following indicator like Wilder's Parabolic. So, you can see we practically don't have obscure places in the algorithm of Jurik Moving Average(JMA)
Summary
Customer reviews
5 | 0 % | |
4 | 100 % | |
3 | 0 % | |
2 | 0 % | |
1 | 0 % |


!["Gaussian Channel [Iridio Capital]" logo](https://cdn.ctrader.com/image/webp/7c039209-5573-4a54-a072-f9528b503103_41960)


