
GUPPY-MASTER V3
Indicator
251 downloads
Version 1.0, Mar 2026
Windows, Mac
5.0
Reviews: 3
Description
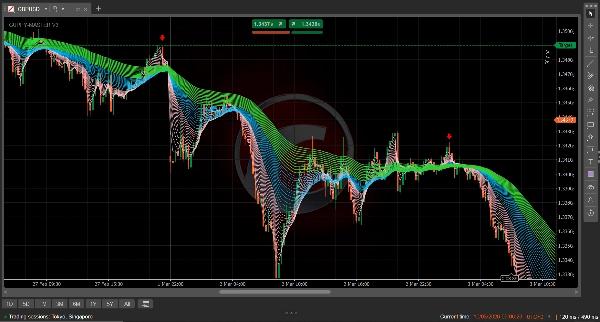
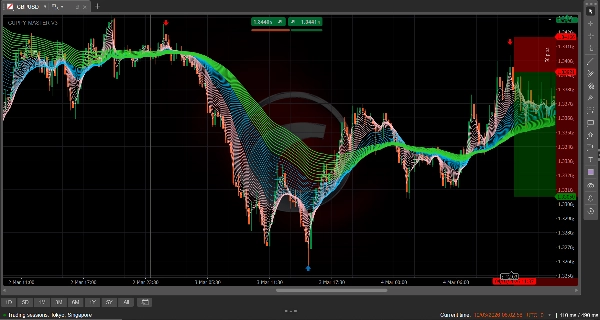
GUPPY TREND MASTER V3 (4X4 TRADING TECHNOLOGY )
Visualize Market Sentiment with the 38-EMA Rainbow
The Guppy Trend Master 4X4 is a premium technical analysis tool for cTrader that transforms complex price action into a clear, color-coded map of market psychology. By plotting 38 Exponential Moving Averages (EMAs) simultaneously, it allows traders to distinguish between temporary "noise" and genuine trend reversals.
The 4X4 Visual Logic
The indicator organizes market data into three distinct "ribbons" to give you a multi-dimensional view of the trend:
- The Pink Ribbon (Periods 2–15): The "Speculator" group. These lines represent the short-term traders. When they fan out, momentum is high. When they compress, the move is exhausting.
- The Blue Ribbon (Periods 17–41): The "Bridge" group. This acts as the critical transition zone. It often serves as the "bounce" area for re-entry during a strong trend.
- The Green Ribbon (Periods 44–74): The "Investor" group. This represents long-term sentiment. A wide, fanning green ribbon indicates a powerful, stable trend that is difficult to break.
Why Use the Indicator?
- Instant Trend Confirmation: See at a glance if the market is trending or ranging. If the ribbons are tangled, stay out. If they are fanned and separated, the trend is strong.
- Precision Scalping Zones: Specifically optimized for M1 and M5 timeframes, the 4X4 highlights the "Buy the Dip" and "Sell the Rip" zones with surgical accuracy.
- Volatility Visualization: The "gap" between the ribbons tells you how much conviction is behind a move. "Clear gaps" (as seen in the 4X4 logic) indicate a high-probability trade environment.
- No Lag Logic: By using Exponential Moving Averages (EMA), the 4X4 reacts to price changes faster than standard SMA-based Guppy indicators, making it superior for modern high-frequency markets.
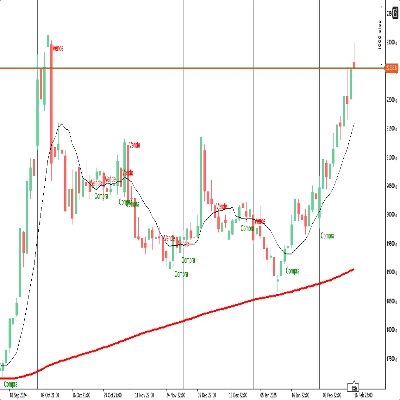
How to Read the Signal
- Bullish Strength: Pink is on top, followed by Blue, with Green at the bottom. All groups are fanning upward with visible space between the lines.
- Bearish Strength: Green is on top, followed by Blue, with Pink at the bottom. All groups are fanning downward.
- The Squeeze: When all three groups converge into a single point, a massive breakout is imminent.
Summary
AI summary
The GUPPY TREND MASTER V3 is a technical analysis indicator designed for the cTrader platform that visualizes market sentiment using 38 Exponential Moving Averages (EMAs). It organizes these EMAs into three color-coded ribbons to provide a multi-dimensional view of market trends: the Pink Ribbon (periods 2–15) reflects short-term speculator activity, the Blue Ribbon (periods 17–41) serves as a transitional bridge zone, and the Green Ribbon (periods 44–74) indicates long-term investor sentiment. This structure helps traders distinguish between market noise and genuine trend reversals.
Key features include instant trend confirmation by observing ribbon separation or entanglement, precision scalping zones optimized for 1- and 5-minute timeframes, and visualization of market volatility through the spacing between ribbons. The use of EMAs ensures faster reaction to price changes compared to traditional SMA-based Guppy indicators, supporting high-frequency trading environments.
Signal interpretation is based on ribbon positioning and spacing: bullish trends show Pink above Blue above Green with upward fanning, bearish trends show the reverse with downward fanning, and convergence of all ribbons signals an imminent breakout. The indicator supports various markets including forex pairs (GBPUSD, USDJPY), cryptocurrencies, stocks, and commodities like gold (XAUUSD).
Indicator profile
Customer reviews
5.0
Reviews: 3
5 | 100 % | |
4 | 0 % | |
3 | 0 % | |
2 | 0 % | |
1 | 0 % |
Customer reviews
March 29, 2026
This is a nice indicator 😀. Overall the images are what is represented on the chart no faking. But only the arrows missing. Let me hope version 2 has them.
March 17, 2026
Very good 👍👍 indicator. Have looked for it every where finally I found it works every well
Discussion
FAQ
Signal
Breakout
Scalping
GBPUSD
Crypto
Stocks
XAUUSD
NAS100
USDJPY
Products available through cTrader Store, including trading bots, indicators and plugins, are provided by third-party developers and made available for informational and technical access purposes only. cTrader Store is not a broker and does not provide investment advice, personal recommendations or any guarantee of future performance.
More from this author


Price
Since 27/02/2026
33.16K
Traded volume
25.96K
Pips won
8
Sales
391
Free installs