
Description
Big Candle Detector
(by Avydel Talbo – Prop Firm Trader at The5%ers & OFP)
Now available for cTrader!
Originally developed for MT5, the ATR Big Candle Detector by Avydel Talbo is a robust tool designed to help traders identify major price action zones and significant candle patterns efficiently and accurately.
Overview
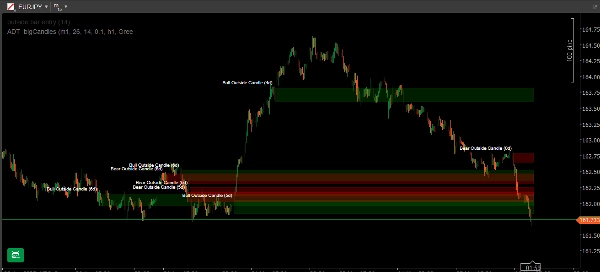
The ATR Big Candle Detector scans your charts for the largest, most significant candlesticks within a user-defined period. Using the Average True Range (ATR) as a volatility filter, it highlights these “big candles” with persistent, color-coded rectangles. Each zone is labeled with the candle’s pattern type and age, providing clear visual context for traders at all levels.
Key Features
- ATR-Based Filtering:
Detects only candles that exceed a customizable ATR threshold, focusing on truly significant moves. - Multiple Pattern Detection:
- Standard Mode: Finds all candles meeting the ATR criteria.
- Special Mode: Filters for classic price action patterns like Outside Bars, Engulfing Candles, Doji, Marubozu, Hammer, Shooting Star, Pin Bars, and Spinning Top (auto-labeled).
- Persistent Rectangles:
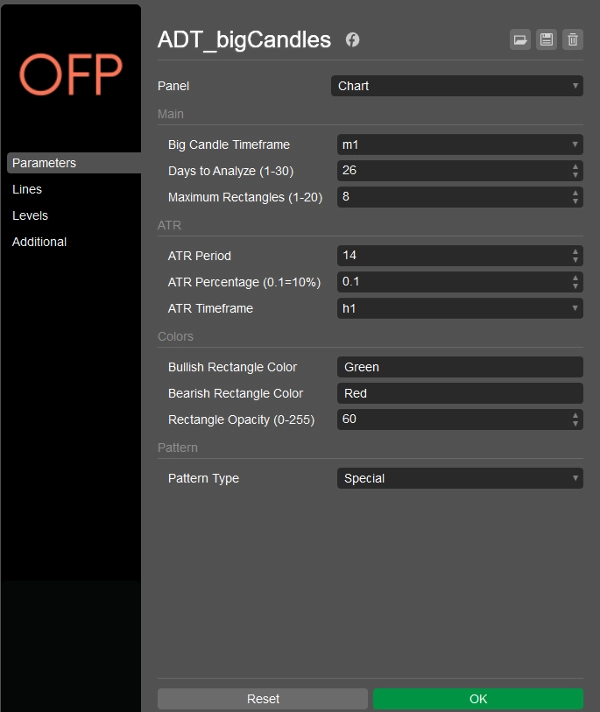
Marks each big candle with a colored rectangle (bullish or bearish) that remains on the chart for reference-ideal for mapping supply/demand and support/resistance zones. - Customizable Settings:
Adjust timeframe, days to scan, ATR period, rectangle appearance, and more. - Overlap Management:
Prevents overlapping rectangles of the same type for a clean chart. - Pattern Labeling:
Each zone is labeled with direction, pattern type, and days since occurrence.
How It Works
- Scans recent candles (up to 30 days back) on your chosen timeframe.
- Calculates ATR to set a dynamic range threshold.
- Detects and ranks the largest candles by range.
- Draws and labels rectangles for quick analysis.
Who Is This For?
- Prop firm and retail traders mapping institutional moves
- Price action and technical analysis traders
- Anyone automating the identification of high-impact candles and zones
About the Author:
A professional prop firm trader at The5%ers and OFP, with extensive experience in price action and zone trading. This indicator is developed based on real trading needs and is used daily in live trading environments.
Perfect for traders who want to automate zone detection and enhance their price action analysis.
Summary
Key features include two detection modes: Standard Mode, which finds all candles exceeding the ATR threshold, and Special Mode, which filters classic price action patterns such as Outside Bars, Engulfing Candles, Doji, Marubozu, Hammer, Shooting Star, Pin Bars, and Spinning Top, with automatic labeling. The indicator prevents overlapping rectangles of the same type for chart clarity and allows customization of timeframe, ATR period, scan duration, and rectangle appearance. Each highlighted zone is labeled with candle direction, pattern type, and age.
This tool is suitable for prop firm and retail traders focused on price action and technical analysis, particularly those automating the identification of high-impact candles and zones for enhanced trading decisions.
Customer reviews
5 | 100 % | |
4 | 0 % | |
3 | 0 % | |
2 | 0 % | |
1 | 0 % |


