Penerangan
🚀 HAI Quantum V4 | Papan Pemuka Perdagangan Berprestasi Tinggi dengan Kejelasan Visual Tiada Tanding
Analisis Quantum yang Dipermudahkan: Jika corak itu ada, V4 akan menemuinya untuk anda.
HAI Quantum V4 mewakili kemuncak reka bentuk antara muka perdagangan profesional, direka untuk menghapuskan bunyi pasaran. Manakala pedagang lain bergelut dengan carta yang mengelirukan, pengguna V4 menikmati kelebihan tidak adil: visualisasi tindakan harga dan kecairan masa nyata yang sangat jelas.
Kami telah mereka papan pemuka ini untuk menjadikan terlepas peluang hampir mustahil. Jika, selepas memerhati isyarat yang disediakan oleh HAI Quantum V4, anda tidak dapat mengenal pasti susunan perdagangan, itu adalah tanda jelas untuk sama ada kekal di tepi atau menilai semula pendekatan keseluruhan anda. Kami telah memadatkan kerumitan matematik ke dalam bentuk visual yang paling mudah supaya anda boleh memberi tumpuan sepenuhnya kepada pelaksanaan yang menentukan.
💎 Manfaat Utama HAI Quantum V4:
- Visualisasi Corak Segera: Berhenti melukis garis secara manual. Panel menonjolkan zon kebarangkalian tinggi dan arah aliran pesanan secara masa nyata.
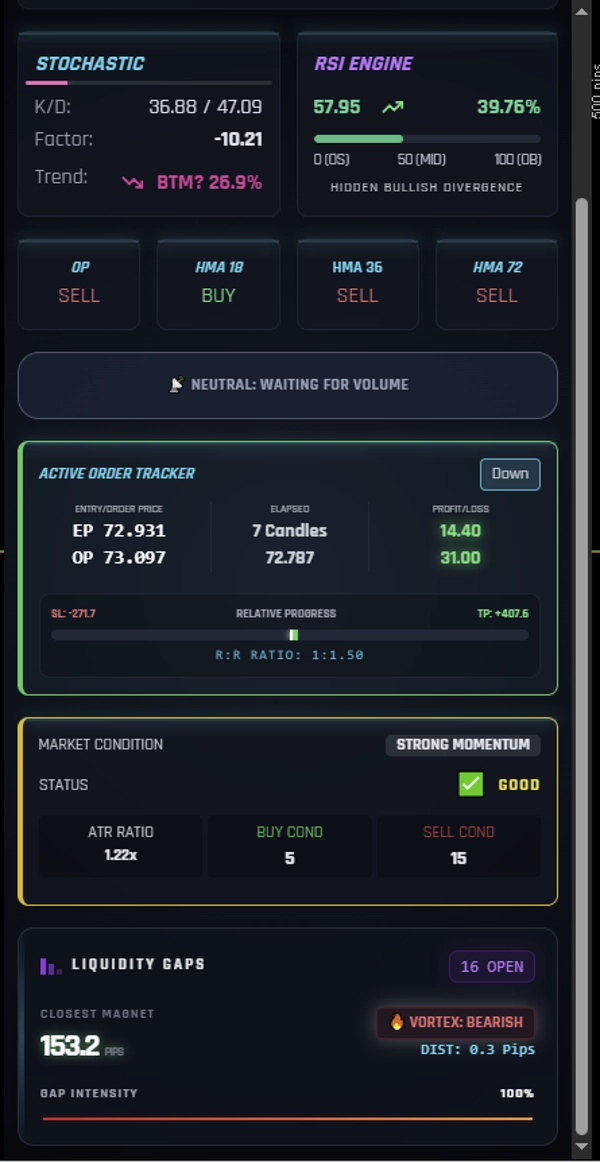
- Analisis Multidimensi: Mengintegrasikan secara lancar Enjin Stokastik, Enjin RSI, dan penjajaran Purata Pergerakan Hull (HMA) ke dalam satu antara muka yang bersih.
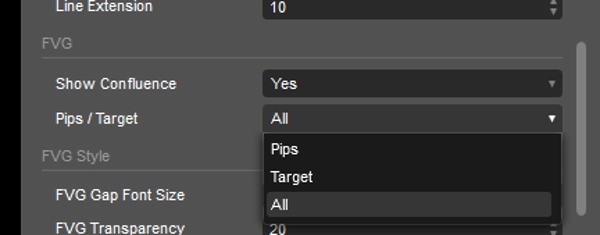
- Penyesuaian Sepenuhnya: Walaupun telah dikonfigurasikan sebagai "mesin isyarat" dari kotak, semua parameter boleh diselaraskan sepenuhnya. Panel menyesuaikan dengan gaya perdagangan anda, bukan sebaliknya.
- Pengurusan Risiko Visual: Jejaki nisbah Risiko/Imbangan (R:R) dan kemajuan masa nyata pesanan aktif anda dengan mudah.
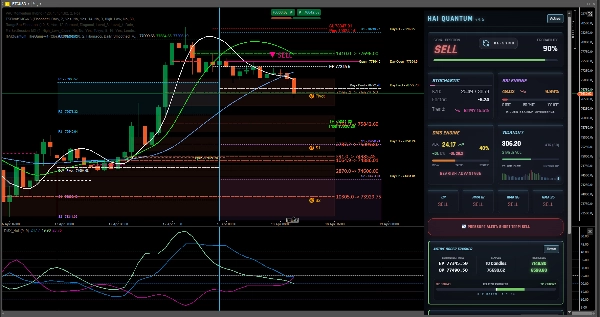
- Status Keadaan Pasaran: Terima penunjuk jelas tentang volum rendah berbanding penjajaran bullish/bearish penuh ("Hyper-drive" / "Meltdown") untuk memastikan anda tidak pernah berdagang secara membuta tuli.
📈 Terbukti dan Disahkan di Pelbagai Pasaran
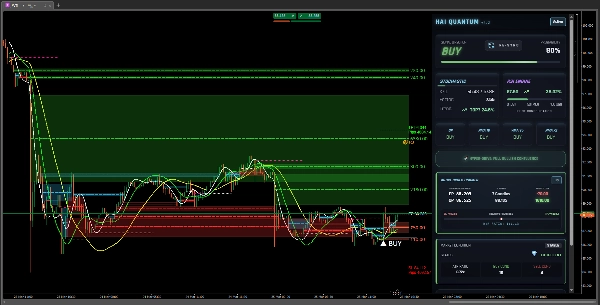
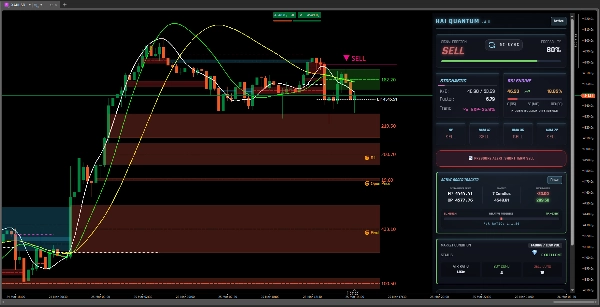
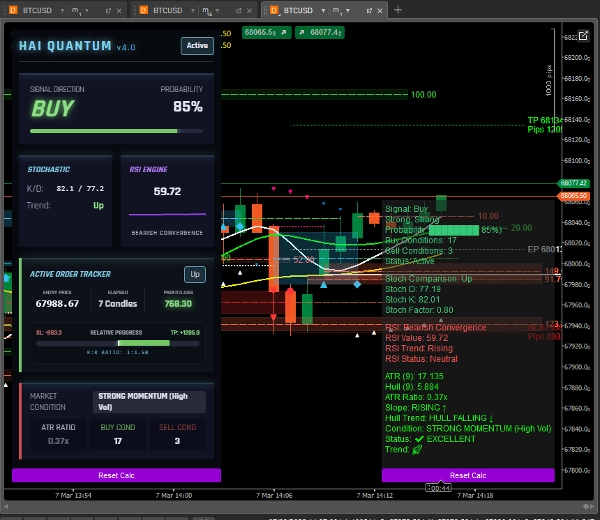
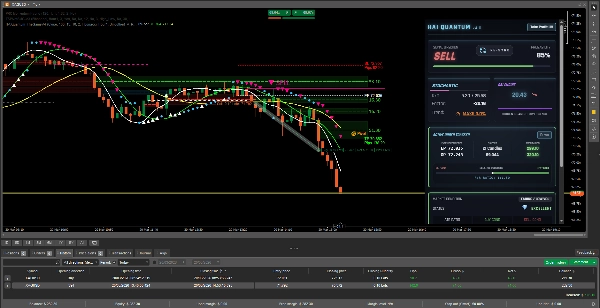
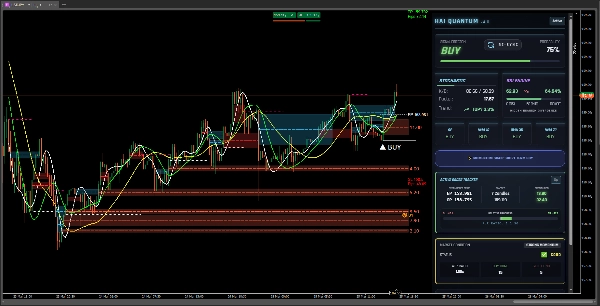
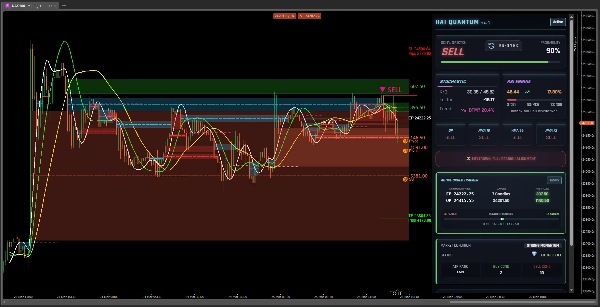
Kepelbagaian algoritma HAI Quantum V4 telah disahkan pada aset paling mencabar dan cair di dunia. Seperti yang ditunjukkan dalam imej yang dilampirkan, panel menyediakan kejelasan dan ketepatan yang konsisten merentasi:
- Forex (Utama): Contohnya, EURUSD. Kenal pasti mikro-tren dan kecairan dalam pasangan yang paling banyak didagangkan.
- Forex (Crosses Volatiliti Tinggi): Contohnya, USDJPY. Mengesan konfluens bullish atau bearish kritikal dalam pasangan berasaskan Yen.
- Komoditi (Tenaga): Contohnya, WTI Crude Oil. Mengenal pasti corak utama dalam pasaran yang dipacu makro.
- Logam Berharga: Contohnya, XAUUSD (Emas). Menapis bunyi teknikal dalam aset tempat perlindungan yang canggih.
Satu papan pemuka. Satu konfigurasi kukuh. Keputusan konsisten dalam mana-mana pasaran.
🛠 Cara Menggunakan:
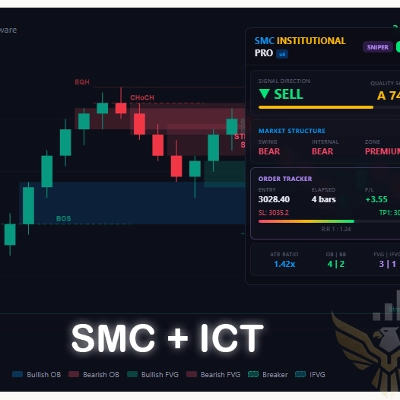
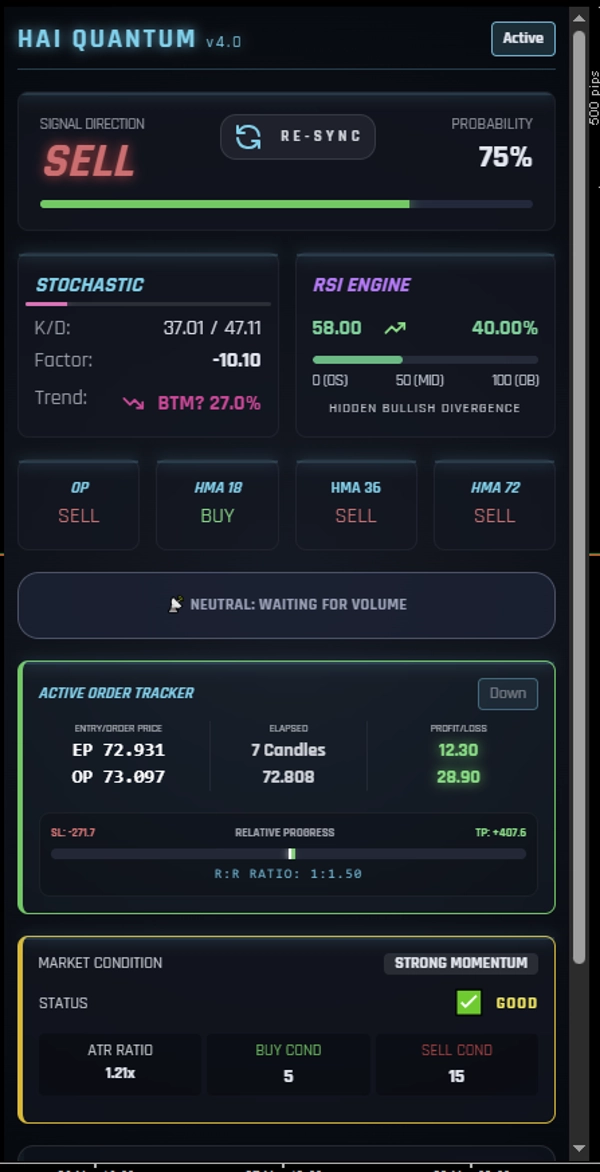
- Analisis: Perhatikan bahagian "Arah Isyarat" dan "Kebarangkalian" pada papan pemuka.
- Sahkan: Sahkan penjajaran teknikal dalam bahagian "Keadaan Pasaran" dan enjin RSI/Stokastik.
- Laksanakan: Jika semua penunjuk bertemu, corak jelas. Laksanakan perdagangan anda dan urus risiko anda dengan sewajarnya.
✅ Kenapa Pilih HAI Quantum V4?
Kerana dalam perdagangan, kejelasan adalah keuntungan. Alat ini telah dipertingkatkan untuk memastikan setiap pedagang—dari pemula hingga profesional—boleh mencapai pulangan konsisten berdasarkan analisis matematik dan visual yang sempurna.
💎 Ciri Analitik Lanjutan (Naik Taraf V4.5)
📊 Enjin DMS: Radar Tren
The DMS (Directional Movement System) bertindak sebagai penapis keyakinan utama. Manakala penunjuk lain hanya menunjukkan arah, DMS mengukur kekuatan di sebalik pergerakan:
- ADX (Indeks Arah Purata): Mengkuantifikasi intensiti tren. ADX tinggi mengesahkan pasaran mempunyai inersia yang diperlukan untuk mencapai sasaran Ambil Untung (TP) anda, manakala ADX rendah memberi amaran tentang julat sisi yang berbahaya.
- DMI (+DI / -DI): Memvisualisasikan pertempuran masa nyata antara pembeli dan penjual. Bahagian Kelebihan Bullish/Bearish segera memberitahu anda siapa yang mengawal aliran pesanan.
⚡ Volatiliti & Aliran Volum: Denyut Pasaran
Untuk isyarat menjadi sah, ia memerlukan "bahan bakar." Panel Volatiliti baru memastikan anda tidak memasuki pasaran "mati":
- ATR (Julat Benar Purata): Memberikan bacaan tepat julat harga yang dijangka, membolehkan anda menetapkan Stop Loss secara teknikal dan bukan emosi.
- Aliran Volum (Mengering / Hyper-drive): Memantau sama ada volum masuk atau keluar dari aset. Jika isyarat mengatakan "Jual" tetapi volum "Mengering," sistem memberi amaran supaya anda menunggu, melindungi modal anda daripada pecahan palsu.
🧠 Bagaimana Ini Melengkapkan Analisis Pasaran
Integrasi DMS dan Volatiliti mencipta corong keputusan yang tidak boleh gagal:
- Arah (The "Apa"): Bahagian Arah Isyarat dan penjajaran HMA menentukan sama ada mencari Beli atau Jual.
- Momentum (The "Bila"): Enjin RSI dan Stokastik mencari titik masuk optimum (terbeli/terjual berlebihan).
- Keyakinan (The "Mengapa"): Enjin DMS mengesahkan jika arah itu mempunyai kekuatan institusi yang mencukupi di belakangnya.
- Keselamatan (The "Berapa Banyak"): Panel Volatiliti menentukan sama ada keadaan pasaran stabil atau tidak menentu, membantu anda memutuskan saiz posisi atau jika lebih baik kekal Neutral: Menunggu Volum.
Keputusan: Dengan penambahan ini, HAI Quantum V4 tidak lagi hanya memberitahu anda ke mana harga akan pergi, tetapi berapa cepat dan berapa kemungkinan ia akan mencapai destinasi. Ia adalah perbezaan antara mengikuti gerak hati dan melaksanakan pelan berdasarkan data matematik berketepatan tinggi.
🛠 Aliran Kerja Dikemas Kini:
- Analisis: Perhatikan isyarat dan peratusan kebarangkalian.
- Sahkan (DMS): Adakah ADX melebihi 20-25? Adakah +DI/-DI mengesahkan kelebihan?
- Tapis (Volatiliti): Adakah volum mencukupi? Jika status adalah "Neutral," kesabaran adalah alat terbaik anda.
- Laksanakan: Apabila arah, kekuatan, dan volum bertemu, pelaksanaan menjadi proses tanpa tekanan.
🔥 Falsafah V4: Perdagangan untuk Pedagang Berorientasikan Keputusan
"Perdagangan yang berjaya tidak seharusnya menjadi teka-teki. Jika anda tidak dapat melihat corak dengan bantuan HAI Quantum V4, adalah lebih baik untuk tidak berdagang. Misi kami adalah memastikan keuntungan menjadi hasil logik daripada tafsiran yang mudah dan tepat."
Ringkasan
Key features include full parameter customizability, visual risk management with real-time tracking of risk/reward ratios and active orders, and clear market condition indicators that distinguish between low volume and strong bullish or bearish trends. The indicator supports multiple asset classes such as major and high-volatility Forex pairs (e.g., EURUSD, USDJPY), commodities like WTI Crude Oil, and precious metals including Gold (XAUUSD).
An advanced Directional Movement System (DMS) engine measures trend strength and buyer-seller dynamics, while a volatility panel monitors market pulse through ATR and volume flow metrics to filter out weak signals. The tool guides users through a structured workflow: analyze signals, validate trend strength, filter by volatility, and execute trades based on converging indicators. This approach aims to enhance decision-making by providing clear, mathematically grounded insights into market direction, momentum, conviction, and safety.
Ulasan pelanggan
5 | 75 % | |
4 | 25 % | |
3 | 0 % | |
2 | 0 % | |
1 | 0 % |