

説明
動的な色の変化とボリュームを備えた高度なMACDインジケーター
説明: 私たちの高度なMACDインジケーターは単なる単純なヒストグラムではありません。このインジケーターは、市場のトレンドを明確かつ動的に表示するよう設計されており、真剣なトレーダーにとって不可欠な独自の機能を備えています。
主な特徴:
- 動的な色の変化:
-
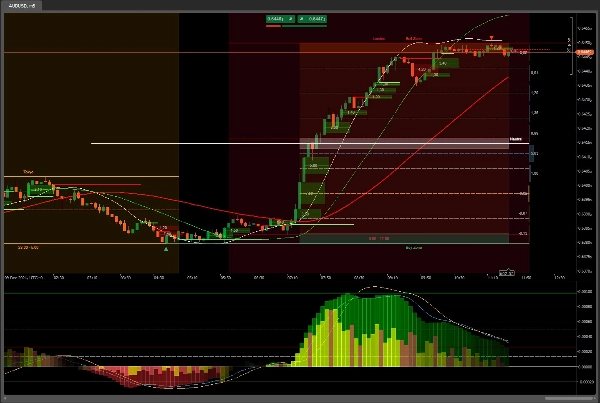
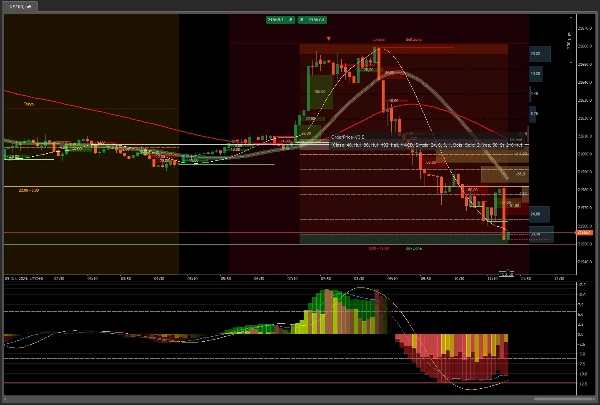
- ポジティブ: 値が増加するにつれてヒストグラムが緑から白に変化し、強気トレンドを明確に視覚化します。
- ネガティブ: 値が減少するにつれてヒストグラムが赤から白に変化し、弱気トレンドを強調します。
- ボリュームインジケーター:
-
- ポジティブボリューム: 緑のバーで表され、取引量の増加を示します。
- ネガティブボリューム: 赤のバーで表され、取引量の減少を示します。
- 明確な視覚化: ボリュームバーの色の組み合わせ(緑、黄色、茶色、赤)が市場の買いと売りの活動を明確に示します。
- 自動ズーム:
-
- インジケーターを中央に保ち、最適な表示のために自動的に調整し、手動での頻繁な調整を不要にします。
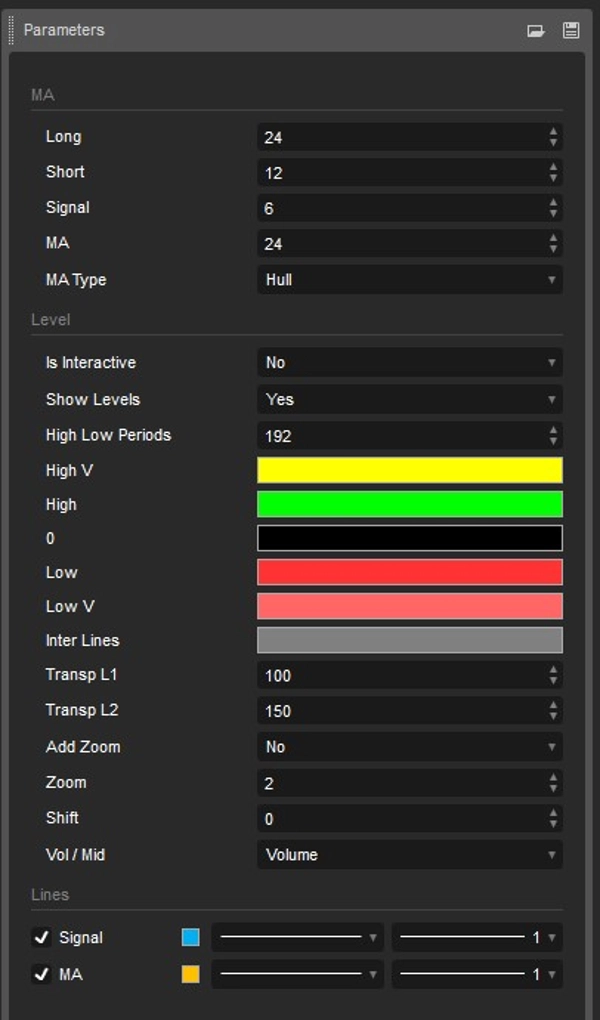
- カスタマイズ可能な移動平均:
-
- 利用可能なオプションから選択できる追加の移動平均を組み込み、トレーディング戦略に合わせてより高度なカスタマイズと適応を可能にします。
- 高値と安値:
-
- 選択した期間の最高値と最安値を表示し、市場の極値を明確に示します。
利点:
- 視覚的明瞭さ: 動的な色の変化により、市場のトレンドや転換点を簡単に識別できます。
- カスタマイズ性: 異なる移動平均の選択や色レベルの調整が可能で、インジケーターを特定のニーズに合わせて調整できます。
- 効率性: 自動ズームにより、手動調整なしで常に最適な表示が保証されます。
- 包括的な分析: ボリュームや高値/安値レベルを含め、市場のより完全なビューを提供します。
対象:
- 技術分析を強化するための高度でカスタマイズ可能なツールを求めるトレーダー。
- 市場トレンドの明確で動的な視覚化を望む方。
- 取引ツールの効率性とカスタマイズ性を重視するユーザー。
以下の追加ツールとともに
OrderPrice V3 https://ctrader.com/products/397
NTMPICLL https://ctrader.com/products/327
Range Box Level https://ctrader.com/products/245
または RangeBoxFibonacci https://ctrader.com/products/526
Market Session https://ctrader.com/products/525
MacdVolume https://ctrader.com/products/267
4MA https://ctrader.com/products/247
あなたは無敵になるでしょう
頑張って 😀
概要
AIによる概要
The MACDVolume indicator is an advanced technical analysis tool combining the Moving Average Convergence Divergence (MACD) histogram with volume data for enhanced market trend visualization. It features dynamic color changes in the MACD histogram: bullish trends are shown by a gradient from green to white, while bearish trends shift from red to white. The volume component uses color-coded bars—green for increasing volume and red for decreasing volume—with additional colors (yellow, brown) to clearly depict buying and selling activity.
Key functionalities include auto zoom, which keeps the indicator centered and optimally scaled without manual adjustment, and a customizable moving average that can be selected from available options to fit different trading strategies. The indicator also displays the highest and lowest price levels within the selected period, providing insight into market extremes.
Designed for traders seeking a customizable and efficient tool, MACDVolume offers clear visual cues for trend identification and comprehensive market analysis by integrating volume and price extremes. It supports markets such as Forex and Stocks and is suitable for users who prioritize clarity, customization, and efficiency in their technical indicators.
インジケーターのプロフィール
カスタマーレビュー
5.0
レビュー: 3
5 | 100 % | |
4 | 0 % | |
3 | 0 % | |
2 | 0 % | |
1 | 0 % |
カスタマーレビュー
January 12, 2026
August 28, 2025
MACDVolume is a strong complementary tool for traders already using MACD. It enhances decision-making by incorporating volume, making signals more trustworthy.
April 17, 2025
ディスカッション
よくあるご質問
Forex
Stocks
MACD
cTrader Storeで入手可能な取引ボット、インジケーター、プラグインなどの商品は、第三者の開発者が提供するものであり、情報と技術の取得のみを目的としてご利用いただけます。cTrader Storeはブローカーではなく、投資助言や個人的な推奨を行うことも、将来のパフォーマンスを保証することもありません。
この作成者の他の商品


価格
147
販売
11.17K
無料インストール