
MTF Candle Window - On Chart
Indicatore
7 acquisti
Versione 1.0, Feb 2025
Windows, Mac
4.3
Recensioni: 3
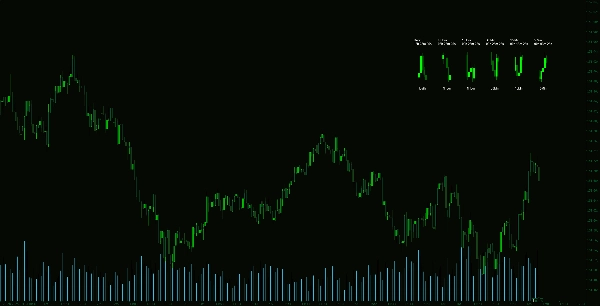
Descrizione
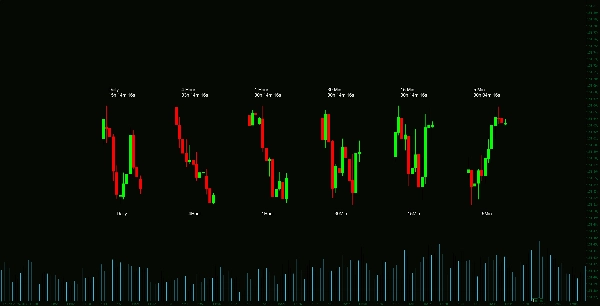
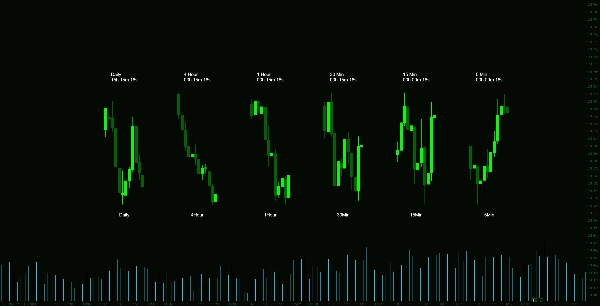
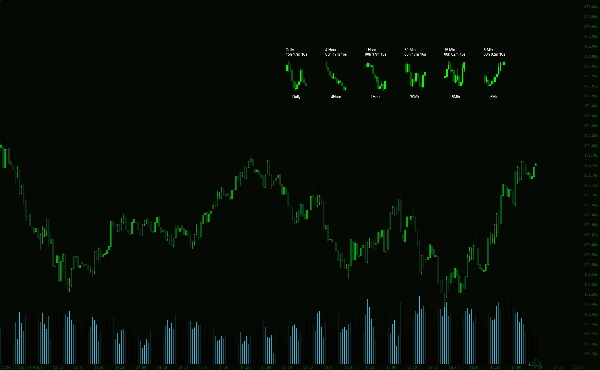
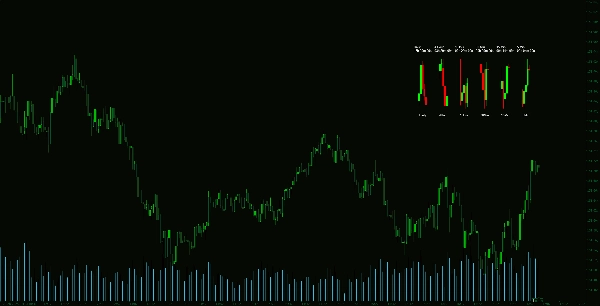
L'Indicatore Multi-Timeframe Candle è uno strumento altamente personalizzabile che offre una visione chiara e compatta dell'azione del prezzo attraverso i principali timeframe. Visualizza le candele di più timeframe in una finestra dedicata, permettendo ai trader di valutare rapidamente la struttura del mercato senza cambiare grafici.
Caratteristiche principali:
Riepilogo
Riepilogo AI
The Multi-Timeframe Candle Indicator is a customizable trading tool that displays price candles from multiple major timeframes within a single dedicated window on the chart. This allows traders to efficiently monitor market structure and price action across different timeframes without switching between charts. Key features include adjustable candle height, horizontal and vertical offsets, and the number of candles shown per timeframe. It also offers a dynamic countdown timer indicating the time remaining until each candle closes, positioned at the top or bottom of the candles. Users can fully customize the appearance by modifying colors, text offsets, and font sizes to suit their trading preferences. This indicator supports streamlined market analysis by helping traders quickly identify trends, reversals, and momentum shifts, enhancing decision-making and trade execution.
Profilo indicatore
Recensioni dei clienti
4.3
Recensioni: 3
5 | 33 % | |
4 | 67 % | |
3 | 0 % | |
2 | 0 % | |
1 | 0 % |
Recensioni dei clienti
February 20, 2025
Entry aware signal check for chart reading. it makes market context easier to scan, especially when used for adding confirmation before a trade. I would test it on 2 timeframes, 20 signals and a 1R stop plan. It is stronger when a 1.5R target is realistic before the entry.
February 19, 2025
February 19, 2025
Setup first trade assistant for a more controlled workflow. It helps with adding confirmation before a trade, but it should not be used as a blind entry trigger. I would test it on 2 timeframes, 20 signals and a 1R stop plan. I would still keep manual review in the process.
Discussioni
Domande frequenti
I prodotti disponibili tramite cTrader Store, inclusi bot di trading, indicatori e plugin, sono forniti da sviluppatori terzi e resi disponibili esclusivamente a scopo informativo e di accesso tecnico. cTrader Store non è un broker e non fornisce consulenze in materia di investimento, raccomandazioni individualizzate o garanzie di risultati futuri.


Prezzo
Da 14/01/2025
55
Vendite
11.36K
Installazioni gratuite