
Description
Unlock a deeper understanding of Forex market dynamics with the comprehensive Relative Currency Strength (RCS) indicator, specifically designed for the cTrader platform.
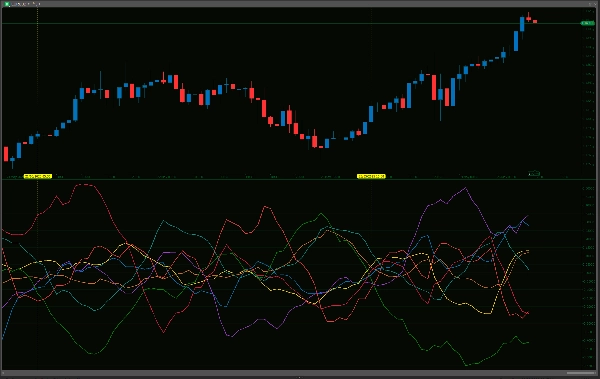
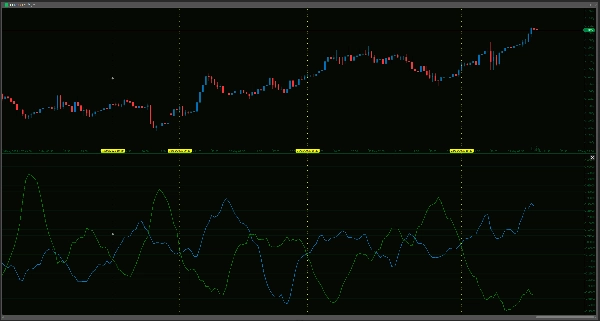
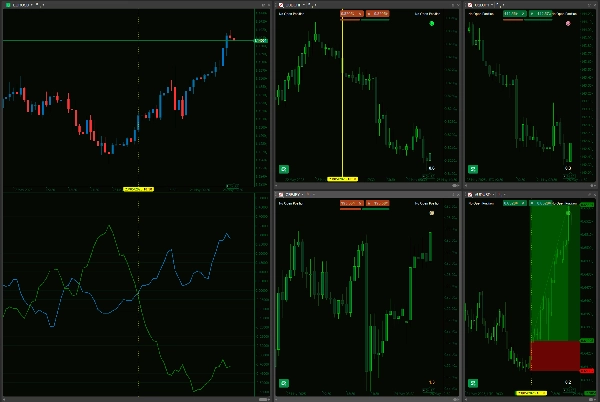
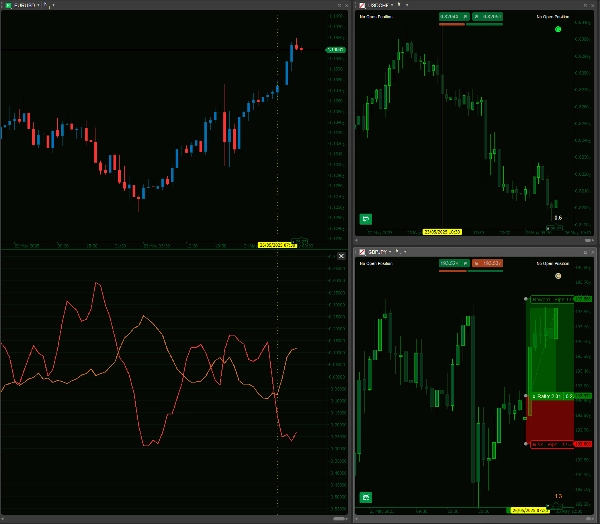
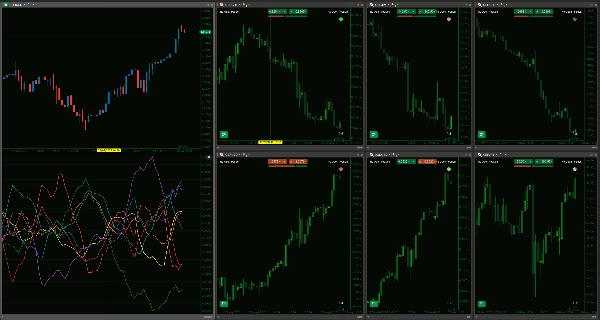
This powerful tool meticulously evaluates the individual performance of eight major currencies—AUD, USD, EUR, JPY, GBP, CAD, CHF, and NZD—by analyzing their percentage change against each other across a basket of 28 currency pairs. With user-defined lookback and smoothing periods, you can fine-tune the indicator's sensitivity to align with your unique trading approach, from rapid scalping to long-horizon strategies. The clear visual output allows for an immediate, at-a-glance comparison, helping you to quickly identify currencies exhibiting strong upward momentum or those showing signs of weakness, which can be instrumental in selecting currency pairs with higher potential for your strategies. It offers a way to move beyond single-pair analysis and see the bigger picture of which individual currencies are truly driving market movements.
It’s crucial, however, to use this indicator with a clear understanding of its capabilities and limitations. The RCS indicator is a sophisticated analytical tool, not an infallible forecasting device or a complete 'set-and-forget' trading system in itself. Its calculations are rooted in historical price data and are intended to augment, not substitute, your established trading methodology, which should always include thorough price action analysis, consideration of fundamental factors, and robust risk management practices. While 'strength' or 'weakness' is highlighted by the lines, these readings require careful interpretation within the broader market context; for instance, a currency showing extreme 'strength' might be approaching an overbought condition or a key resistance level.
The indicator's performance can also fluctuate with prevailing market conditions (e.g., it may behave differently in strongly trending versus sideways, choppy markets), and its accuracy relies on your platform having sufficient, clean historical data for all 28 currency pairs involved. While optimized for ongoing calculations, the initial data loading for such a comprehensive cross-currency analysis can be demanding on platform resources, especially on slower connections or less powerful hardware. By providing a nuanced, multi-currency perspective, this RCS indicator is offered as a valuable aid to help you make more informed, strategically sound trading decisions and potentially enhance your edge in the competitive Forex arena, rather than as a standalone solution.
Please check that your broker offers all cross pairs within this indicator in order for it to work.
--------------------------
Please feel free to check out my other indicators!
https://ctrader.com/products/1181
https://ctrader.com/products/1182
https://ctrader.com/products/1180
https://ctrader.com/products/1015
https://ctrader.com/products/555
https://ctrader.com/products/553
https://ctrader.com/products/554
https://ctrader.com/products/552
https://ctrader.com/products/557
https://ctrader.com/products/845
https://ctrader.com/products/848
https://ctrader.com/products/847
https://ctrader.com/products/846
https://ctrader.com/products/551
https://ctrader.com/products/574
https://ctrader.com/products/573
https://ctrader.com/products/556
https://ctrader.com/products/558
https://ctrader.com/products/559
https://ctrader.com/products/560
Summary
The indicator provides a clear visual representation of currency strength and weakness, enabling traders to identify currencies with strong momentum or signs of weakness at a glance. This multi-currency perspective helps move beyond single-pair analysis to understand which currencies are driving market movements.
The tool relies on historical price data and requires all relevant currency pairs to be available from the broker. Its performance may vary with market conditions, and it is intended to complement, not replace, comprehensive trading strategies that include price action, fundamental analysis, and risk management. Initial data loading can be resource-intensive due to the breadth of cross-currency calculations.
This indicator serves as an analytical aid to support more informed Forex trading decisions by highlighting relative currency strength across major pairs.
Customer reviews
5 | 33 % | |
4 | 67 % | |
3 | 0 % | |
2 | 0 % | |
1 | 0 % |


