"Yen Strength - Line Momentum" logo
Yen Strength - Line Momentum
"Yen Strength - Line Momentum" uploaded image
Since 14/01/2025
46
Sales
9.67K
Free installs

Discover Powerful Insights into the Japanese Yen’s Performance with the JPY Strength Indicator

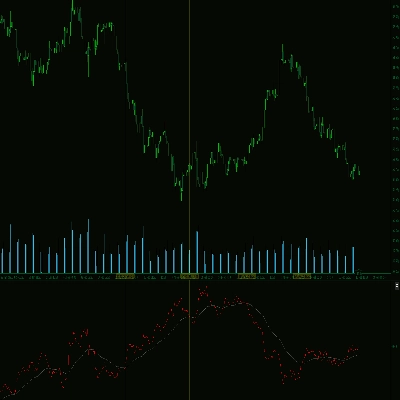
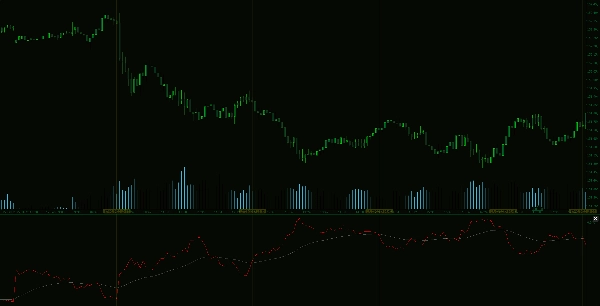
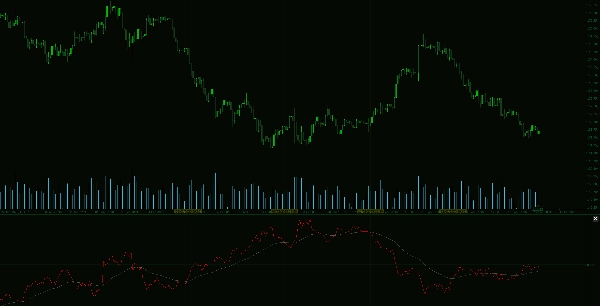
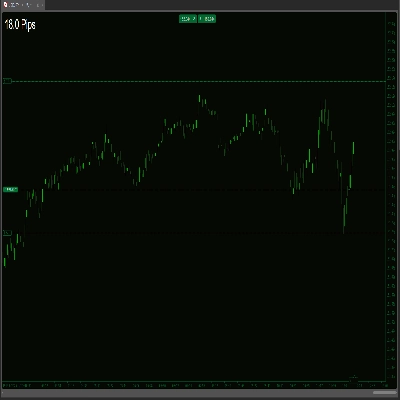
Elevate your forex trading strategy by accurately gauging the Japanese Yen’s strength in one streamlined glance. Our JPY Strength Indicator automatically aggregates price data across multiple major JPY pairs—USDJPY, EURJPY, GBPJPY, AUDJPY, and NZDJPY—to deliver a single, intuitive line that represents the Yen’s overall direction.

Key Benefits & Features:

Indicator profile
0.0
Reviews: 0
Customer reviews
No reviews for this product yet. Already tried it? Be the first to tell others!
Forex
Signal
USDJPY
Products available through cTrader Store, including trading bots, indicators and plugins, are provided by third-party developers and made available for informational and technical access purposes only. cTrader Store is not a broker and does not provide investment advice, personal recommendations or any guarantee of future performance.

More from this author

Track major trading sessions (Tokyo, London, New York) with customizable colors and visual sessions on your chart.
Auto-detect supply & demand zones, remove broken levels, and trade smarter with real-time alerts. Precision made simple.
Market Session V2: Full Control. colors, history, session/text toggles, font size. Elevate your strategy!
Version 3: Full control of session display including start and end times of all 3 sessions!
Supply and demand zones. They're important. Here's a free version to get you started!
The Multi-Timeframe Candle Indicator displays candles from multiple timeframes in one window, enhancing market analysis!
VWAP Set to London Open
The Advanced Volume Profile Indicator calculates POC, Median, and Mode, revealing key price levels for smarter trading.
VWAP Set to Tokyo Open
RCS: 8 majors! AUD,USD,EUR,JPY,GBP,CAD,CHF,NZD. Find how strong each currency is relatively and trade smarter!
US Dollar Index
Stay ahead with a real-time countdown to candle closes on all key timeframes: 5m, 15m, 30m, 1H, 4H, and Daily.

You may also like

The Structure Fractal indicator is designed to identify and visualize key market structure points
BW_MFI Vizual colors bars
Connects each moving average value from candle to candle, forming a fan-like structure of trendlines.
ICT Breakers (BOS/MSS) - Professional market structure and breakout detection tool.
[Hamster-Coder] Pivot Points (Multi Time Frame)
Visually map NASDAQ liquidity cycles on your chart using exact NY time. Includes a live countdown dashboard.
Flags breakouts of recent highs/lows on cTrader charts. Shows arrows/lines. Optional trend filter & sound alerts 📉📈
Dominio del mercado. BOS/CHOCH + Liquidez con precisión quirúrgica. ESPAÑOL
This indicator is a simple, single-timeframe tool for showing candle sentiment directly on your chart. If you want a mor
A straightforward yet effective tool signals entry points for both buying and selling. Include 3 Moving Average
Robust Cumulative delta,Atr and imbalance indicator.
Dynamic Swing Anchored VWAP
A visual indicator designed to help traders identify and track market activity across different trading sessions.
This indicator puts three helpful trading tools on your chart at once. Think of it like having three expert traders
Automatically draws major, minor, and trace support/resistance levels at round numbers
Useful indicator for traders who want to visualize key price levels based on previous daily highs and lows.
The Advanced Crosshair is a tool that helps you visualize better the data on the chart inside your cTrader platform.
CandleTimer ticking remaining time.
Since 14/01/2025
46
Sales
9.67K
Free installs