
PDHL
Indicator
1.84K downloads
Version 1.0, Sep 2024
Windows, Mac
2.5
Reviews: 2
Description
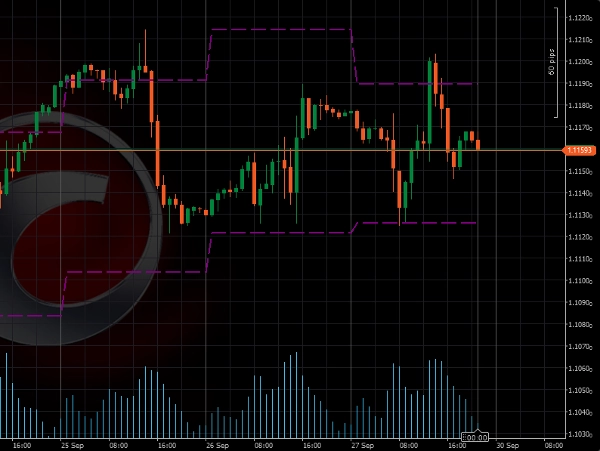
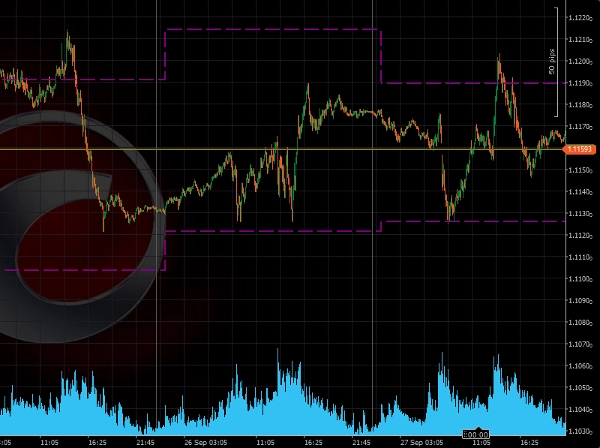
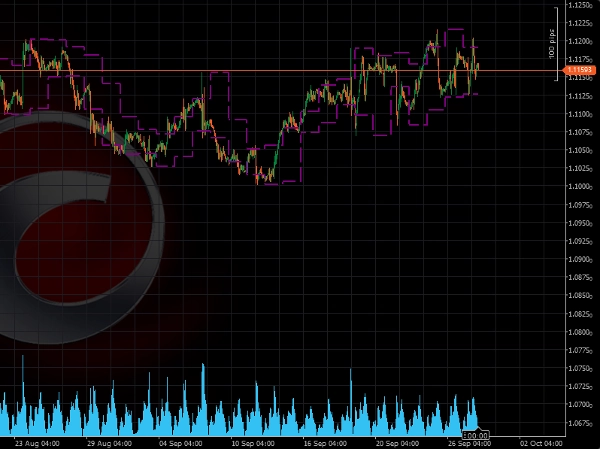
Introducing the High-Low Trading Indicator
This indicator is designed to automatically plot the previous day's highest and lowest price levels on your chart. This tool helps you quickly identify key levels for potential breakouts and reversals.
Key Benefits:
- Ideal for Breakout Trading: This indicator highlights critical price levels from the prior day, which are often used as reference points for breakout strategies. Trading breakouts above or below these levels can offer high-potential setups.
- Simple Yet Effective: The High-Low Trading Indicator focuses on one of the most important aspects of price action – the previous day’s high and low. By incorporating these levels into your strategy, you gain a clearer sense of market structure and potential turning points.
Attentions:
- Best used on timeframes less than 1 Day
Settings:
- Include Sunday: default = no
Summary
AI summary
The PDHL (Previous Day High & Low) indicator automatically plots the prior day's highest and lowest price levels on trading charts. It is designed to assist traders in identifying key price levels that may signal potential breakouts or reversals. By highlighting these critical levels, the indicator supports breakout trading strategies, providing reference points for entering trades when price moves above or below the previous day's range. The tool emphasizes simplicity and effectiveness by focusing on essential price action elements, helping traders better understand market structure and potential turning points. It is best used on intraday timeframes shorter than one day. A configurable setting allows users to include or exclude Sunday in the calculation, with the default setting excluding it.
Indicator profile
Customer reviews
2.5
Reviews: 2
5 | 0 % | |
4 | 0 % | |
3 | 50 % | |
2 | 50 % | |
1 | 0 % |
Customer reviews
October 9, 2025
What Timezone is it in at default? It seems to fail to get the accurate Highs and lOws for different istruments. You could add that as a customisable input. Please add closing price too
July 9, 2025
Pros: Simple and clear display of previous day's high/low levels. Stable performance. Easy to use and customize. Cons: No breakout alerts. No visual zone fill option. Lacks additional filters or Fibo levels.
Discussion
FAQ
Breakout
Products available through cTrader Store, including trading bots, indicators and plugins, are provided by third-party developers and made available for informational and technical access purposes only. cTrader Store is not a broker and does not provide investment advice, personal recommendations or any guarantee of future performance.
More from this author


Price
Since 24/09/2024
4.45K
Free installs