
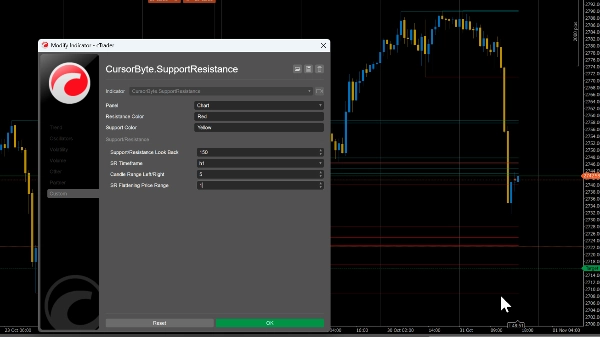
CursorByte.SupportResistance v3
Indicator
292 downloads
Version 1.0, Mar 2025
Windows, Mac
5.0
Reviews: 1
Description
***Improved version***
https://ctrader.com/products/2113
***********************
You can set the flattening price range based on the pair. Either 0.0001 for pairs like GU and 1.5 for Gold.
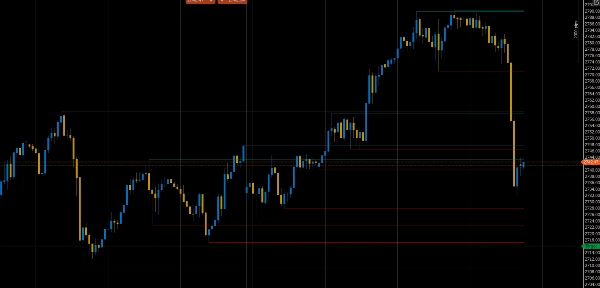
This indicator automatically identifies key support and resistance levels on the chart, helping traders spot potential reversal zones, breakout points, and areas of price consolidation for better entry and exit decisions.
NB: Use the flattening price range to reduce clutter on the chart (consolidate SR lines within a particular price range into one).
Summary
Indicator profile
Customer reviews
5.0
Reviews: 1
5 | 100 % | |
4 | 0 % | |
3 | 0 % | |
2 | 0 % | |
1 | 0 % |
Customer reviews
August 12, 2025
Pros: Accurate auto SR levels, customizable design, stable performance. Cons: No significance filter, no auto-clear, possible chart clutter.
Discussion
FAQ
Breakout
Commodities
XAUUSD
Products available through cTrader Store, including trading bots, indicators and plugins, are provided by third-party developers and made available for informational and technical access purposes only. cTrader Store is not a broker and does not provide investment advice, personal recommendations or any guarantee of future performance.


Price
Since 31/10/2024
56
Sales
1.75K
Free installs