
📊 Daily Pip Range Dashboard (Session-Aligned ADR Tool)
The Daily Pip Range Dashboard is a professional trading utility that displays real-time daily range statistics directly on your chart — fully aligned to your broker’s UTC session.
Designed for precision traders, this tool calculates the High-Low pip range using true session-based daily boundaries and provides powerful rolling statistics for market context and volatility analysis.
🔥 Key Features
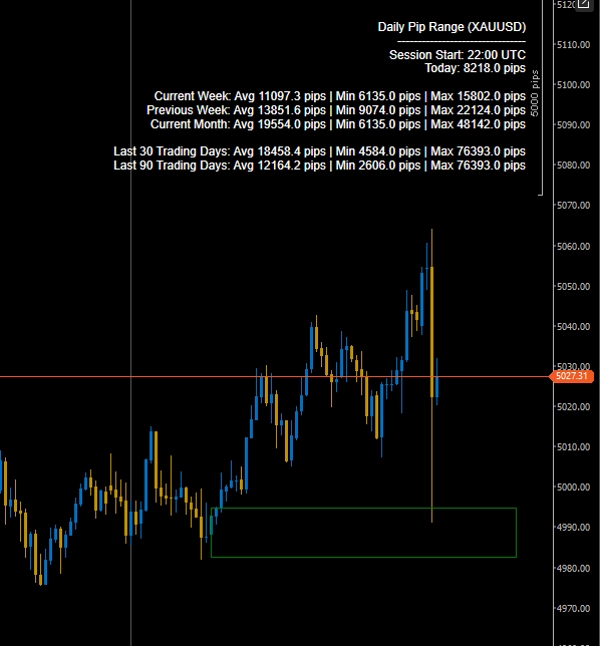
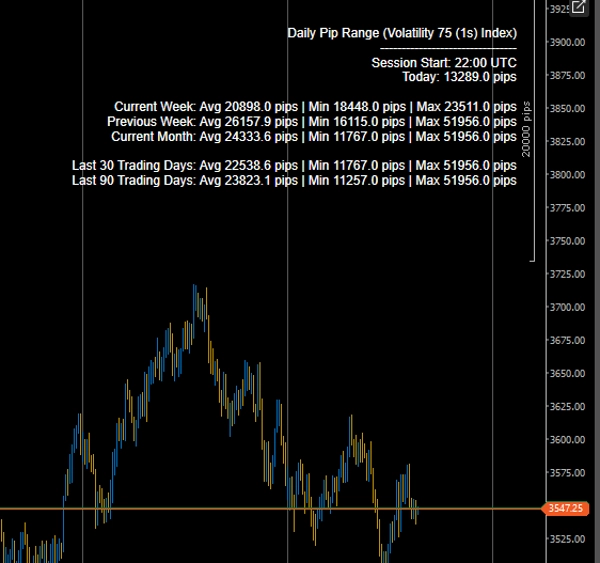
✅ Today’s Live Daily Range (High–Low in Pips)
See the current session’s pip range update in real time.
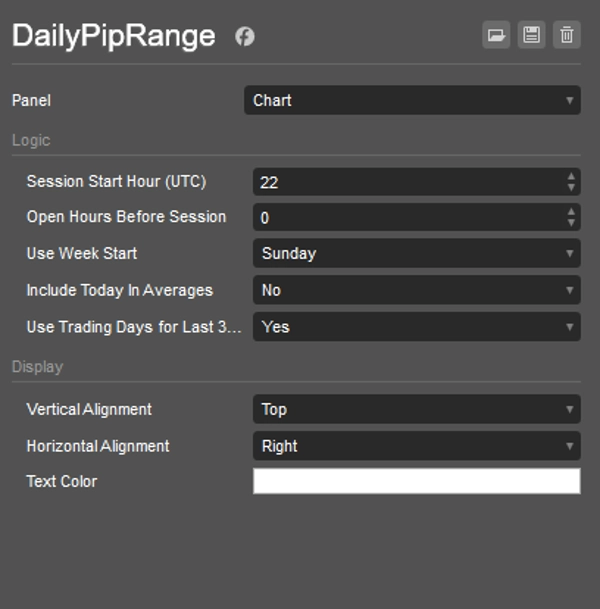
✅ Session-Aligned Calculations (UTC Controlled)
Define:
- Session Start Hour (UTC)
- Open Hours Before Session
This ensures your daily statistics match your broker’s trading day — ideal for NY Close alignment and institutional-style analysis.
✅ Advanced Statistical Breakdown
For each period, the indicator shows:
- Average Daily Range
- Minimum Daily Range
- Maximum Daily Range
Included periods:
- Current Week
- Previous Week
- Current Month
- Last 30 Days
- Last 90 Days
✅ Trading Days or Calendar Days Toggle
Choose between:
- Last 30/90 calendar days
- Last 30/90 trading days (Daily bars only)
Perfect for filtering out weekends and non-trading gaps.
✅ Customizable Display
- Adjustable screen position (top-right, etc.)
- Text color customization
- Lightweight and non-intrusive overlay
🎯 Why Use This Tool?
- Identify volatility expansion and contraction
- Compare today’s range to historical averages
- Spot compression before breakouts
- Filter trades based on ADR context
- Improve risk sizing based on volatility conditions
Whether you trade intraday, swing, or gold, this tool gives you immediate volatility intelligence without clutter.
⚙️ Ideal For
- Forex Traders
- Gold (XAUUSD) Traders
- Index Traders
- Volatility-Based Systems
- Breakout Traders
- Institutional-style range analysis
🚀 Professional Volatility Awareness - Directly On Your Chart
Built for performance, accuracy, and session precision.
5 | 50 % | |
4 | 50 % | |
3 | 0 % | |
2 | 0 % | |
1 | 0 % |


!["High-Low Divergence [Iridio Capital]" logo](https://cdn.ctrader.com/image/webp/443c4661-7abb-40f1-842f-4b6ec560649b_40914)


