
Penerangan
Market Structure Pro – Garis Tren, Zon & Masuk Pintar
Market Structure Pro adalah satu set alat tindakan harga lengkap yang secara automatik memetakan struktur ayunan pasaran, sokongan/rintangan utama, garis tren sebenar, dan zon HH/LL—kemudian secara pilihan menonjolkan kemasukan pullback berkemungkinan tinggi dengan logik pengesahan terbina dalam.
Daripada melukis semuanya secara manual, penunjuk ini sentiasa mengimbas carta anda di latar belakang dan memastikan struktur, zon dan isyarat anda sentiasa dikemas kini secara masa nyata.
Apa yang dilakukan oleh penunjuk ini
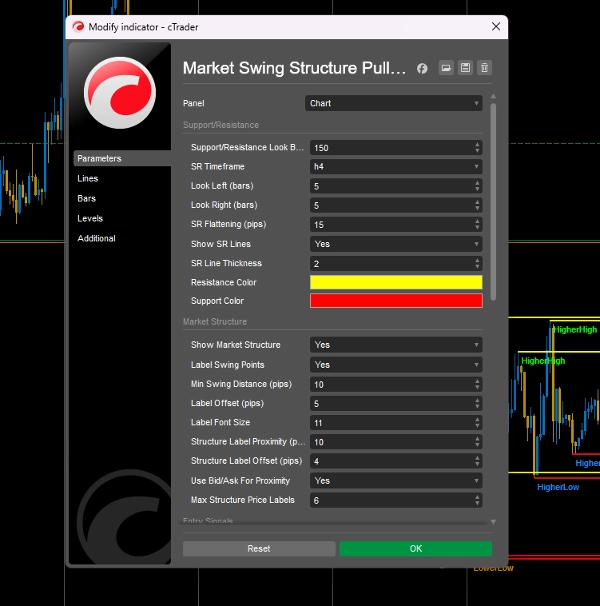
- Sokongan & Rintangan Automatik
-
- Mengesan ayunan tinggi/rendah dalam julat lihat balik yang boleh dikonfigurasikan.
- Meratakan tahap berhampiran menjadi zon yang lebih kemas menggunakan toleransi pip.
- Melukis garis SR interaktif pada mana-mana jangka masa yang dipilih (contoh: SR 4H pada kemasukan M15).
- Ketebalan dan warna yang boleh disesuaikan sepenuhnya untuk sokongan dan rintangan.
- Garis Tren Luar Sebenar
-
- Membina garis tren sokongan dan rintangan menaik/menurun dari titik ayunan yang disahkan.
- Kawalan untuk mengehadkan berapa banyak garis tren setiap arah yang dipaparkan dan untuk melanjutkannya ke masa depan.
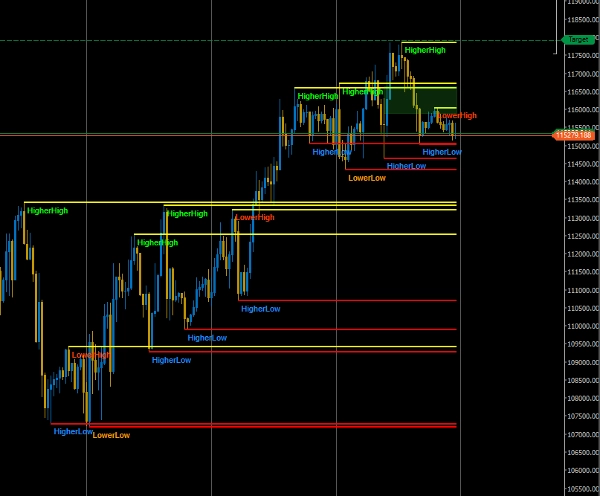
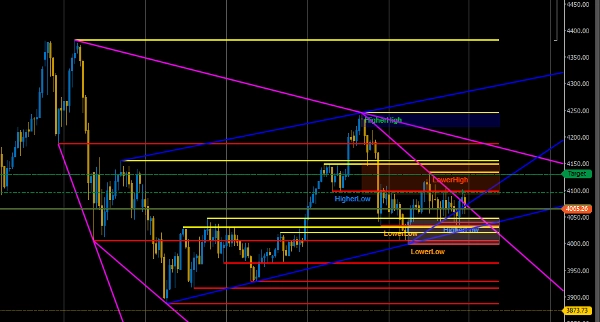
- Pemetaan Struktur Pasaran (HH, HL, LH, LL)
-
- Melabelkan ayunan Tinggi Lebih Tinggi, Rendah Lebih Tinggi, Tinggi Lebih Rendah, Rendah Lebih Rendah terus pada carta.
- Jarak ayunan minimum yang boleh disesuaikan (pips) untuk menghapuskan bunyi pasaran.
- Mengehadkan bilangan label aktif supaya carta anda kekal kemas.
- Teks langsung yang menunjukkan “Trend Semasa” (Uptrend / Downtrend / Sideways, dengan nota pembalikan).
- Mesej “Ramalan Struktur Seterusnya” terbina dalam untuk memberikan konteks arah.
- Zon Lilin Sumber HH/LL
-
- Melukis zon secara automatik dari lilin sumber Tinggi Lebih Tinggi dan Rendah Lebih Rendah terakhir.
- Tiga mod zon:
-
- Lilin Penuh (tinggi ↔ rendah)
- Hanya Badan (julatan buka/tutup)
- Hanya Sumbu (sumbu atas untuk HH, sumbu bawah untuk LL)
- Padding zon (pips), kelegapan, warna untuk zon panjang/pendek, dan pilihan untuk melanjutkan zon ke bar semasa.
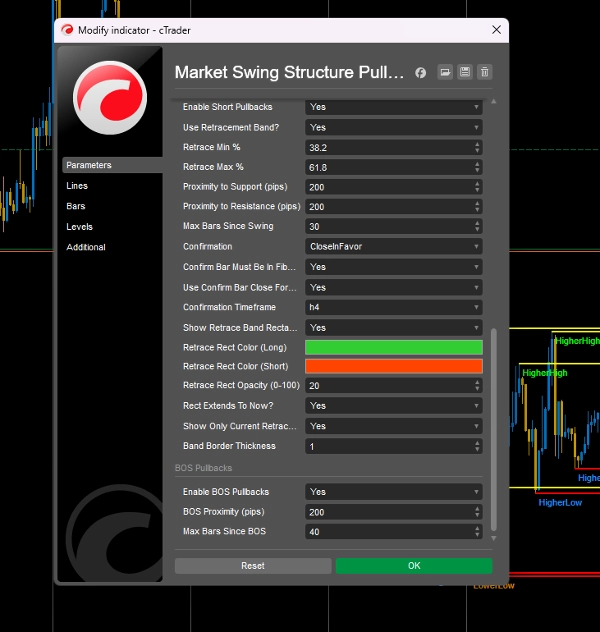
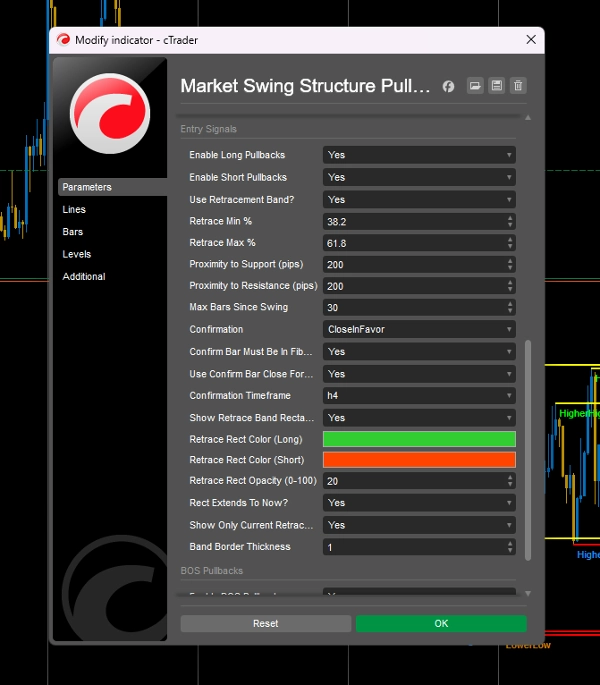
- Isyarat Masuk Pintar (pilihan)
-
- Togol utama untuk menghidupkan/mematikan semua isyarat masuk.
- Kemasukan pullback ayunan:
-
- Menggunakan kaki impuls terkini (HH–HL atau LH–LL).
- Membina jalur retracement gaya Fibonacci (contoh: 38.2–61.8%) untuk beli/jual.
- Memeriksa kedekatan dengan titik ayunan dan tahap SR.
- Mengehadkan berapa banyak bar selepas ayunan isyarat masih sah.
- Pullback Break-of-Structure (BOS):
-
- Mengesan BOS melalui pecahan LH/HL utama.
- Mencari retest tahap BOS dan SR berhampiran.
- Menggunakan penapis kedekatan dan “bar sejak BOS” yang berasingan.
- Enjin Pengesahan
-
- Pelbagai mod pengesahan untuk kemasukan:
-
- Tutup hanya untuk arah yang disukai
- Lilin engulfing sahaja
- Tutup + Engulfing
- Tiada (isyarat mentah)
- Keperluan pilihan bahawa lilin pengesahan juga mesti berada di dalam jalur retrace.
- Jangka masa pengesahan berasingan (contoh: sahkan pada H4 semasa berdagang M15).
- Anda boleh memilih untuk menggunakan penutupan bar pengesahan sebagai harga/masa isyarat sebenar.
- Kawalan Visual & Prestasi
-
- Offset label yang boleh disesuaikan, saiz fon, dan maksimum label struktur.
- Kelegapan segi empat tepat, ketebalan sempadan, dan tingkah laku “lanjutan ke sekarang” untuk jalur retrace dan zon.
- Kemas kini berasaskan pemasa untuk memastikan pengiraan cekap walaupun pada jangka masa yang lebih rendah.
Sesuai untuk
- Pedagang tindakan harga yang bergantung pada struktur pasaran (HH/HL/LH/LL).
- Pedagang ayunan dan intrahari yang mahukan SR dan garis tren jangka masa lebih tinggi kelihatan pada carta kemasukan mereka.
- Pedagang yang mencari kemasukan pullback berasaskan peraturan di sekitar struktur utama, zon dan tahap BOS dengan pengesahan yang jelas.
Cara menggunakan
- Pilih jangka masa SR anda (contoh: H4) dan julat lihat balik.
- Hidupkan Garis Tren dan laraskan sama ada anda mahu ia dilanjutkan dan ditapis untuk jurang hujung minggu.
- Hidupkan Struktur Pasaran dan label untuk melihat HH/HL/LH/LL dan trend/ramalan langsung.
- Hidupkan Zon dan pilih mod julat pilihan anda (Penuh, Badan, atau Hanya Sumbu).
- Jika anda mahu isyarat, hidupkan Isyarat Masuk, tetapkan jalur retrace anda (contoh: 38.2–61.8%), kedekatan dan tingkah laku pengesahan.
Anda masih mengawal pengurusan risiko dan pelaksanaan anda – Market Structure Pro memberi anda rangka kerja visual yang tersusun supaya anda boleh fokus pada membuat keputusan, bukan melukis.
Ringkasan
It features auto-drawn zones based on the last Higher High and Lower Low source candles, with options for full candle, body only, or wick-only ranges. Smart entry signals include swing pullback entries using Fibonacci-style retracement bands and break-of-structure (BOS) pullbacks, both filtered by proximity and time since the swing or BOS event. A confirmation engine supports multiple modes such as close-in-favor, engulfing candles, or combined confirmations, with configurable confirmation timeframes and signal price options.
Visual and performance controls allow adjustment of label offsets, font sizes, opacity, and update frequency to maintain chart clarity and efficiency. Market Structure Pro supports various markets including Forex, indices, commodities, stocks, and cryptocurrencies, and is suitable for price-action, swing, and intraday traders seeking structured, rule-based analysis and entry signals without manual drawing.
Ulasan pelanggan
5 | 33 % | |
4 | 67 % | |
3 | 0 % | |
2 | 0 % | |
1 | 0 % |


