


Penerangan
SMC Smart Money Suite Pro — Peralatan Lengkap Tindakan Harga Institusi untuk cTrader
Jika anda berdagang menggunakan konsep wang pintar atau mana-mana metodologi tindakan harga yang berakar pada aliran pesanan institusi, anda tahu kesakitannya: selusin penunjuk tersebar di seluruh carta anda, setiap satu melakukan sebahagian tugas, tiada satu pun yang berkomunikasi antara satu sama lain. Smart Money Suite Pro dibina untuk menyelesaikan itu sepenuhnya.
Ini adalah penunjuk tunggal, berdiri sendiri yang merangkumi setiap konsep utama dalam tindakan harga institusi dan metodologi wang pintar — direka dari asas untuk cTrader, dioptimumkan untuk berjalan lancar pada carta langsung tanpa berkelip, dan dipenuhi dengan ciri-ciri kualiti hidup yang menjadikannya benar-benar boleh digunakan dalam sesi perdagangan sebenar.
Struktur Pasaran — Automatik dan Tepat
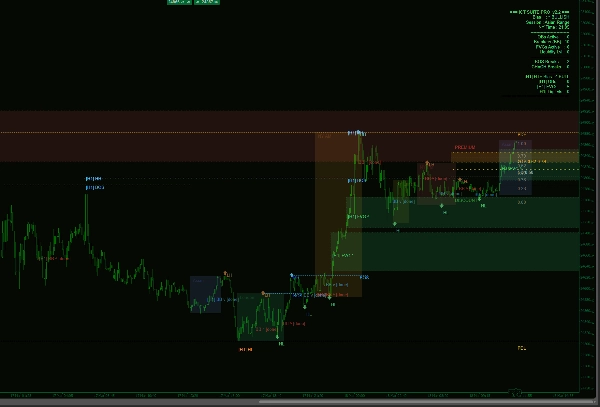
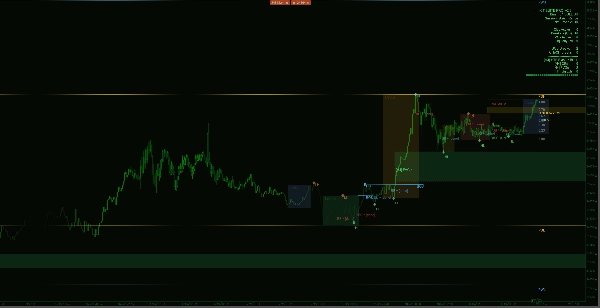
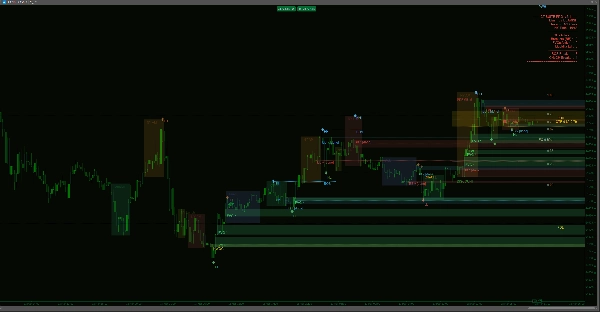
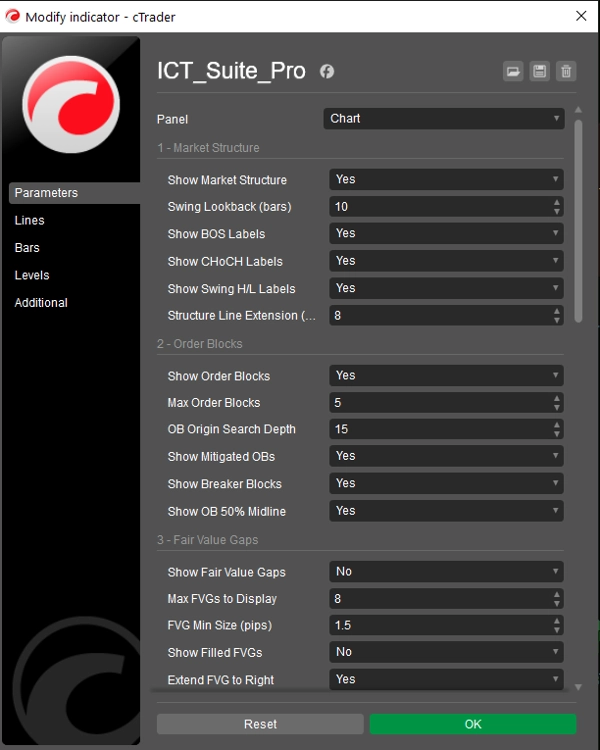
Penunjuk ini sentiasa mengimbas carta anda untuk ayunan tinggi dan rendah yang disahkan, mengklasifikasikan setiap satu sebagai Tinggi Lebih Tinggi, Tinggi Lebih Rendah, Rendah Lebih Tinggi, atau Rendah Lebih Rendah. Setiap Pecahan Struktur (BOS) dan Perubahan Watak (CHoCH) dikesan dan dilabel dengan garis tahap bertitik supaya anda dapat melihat dengan tepat di mana harga memecahkan struktur sebelumnya. Perbezaan antara BOS (sambungan trend) dan CHoCH (pembalikan trend) dikodkan warna supaya ia dapat dibaca dengan segera. Kedalaman pandangan semula ayunan boleh disesuaikan sepenuhnya.
Blok Pesanan — Dengan Penjejakan Kitaran Hayat Penuh
Blok pesanan dikenalpasti dengan mencari lilin bertentangan terakhir sebelum setiap pergerakan impuls yang membawa kepada ayunan yang disahkan. Setiap blok dilukis sebagai kotak berwarna yang memanjang ke kanan carta supaya anda dapat melihat dengan cepat sama ada harga telah kembali ke zon tersebut. Apabila blok pesanan dihapuskan, segi empat tepat itu dikeluarkan dan digantikan dengan penanda teks samar — mengekalkan carta anda bersih sambil menyimpan rekod tahap tersebut. Apabila harga kemudian melanggar melalui sisi lain blok pesanan yang dihapuskan, ia diklasifikasikan semula sebagai Blok Pemecah dan diwarnakan semula, menandakan zon pembalikan yang berpotensi. Garis tengah 50% dilukis di dalam setiap blok aktif untuk menyerlahkan pembahagian premium/diskaun dalam zon itu sendiri.
Jurang Nilai Adil — Dikesan Sehingga Terisi
Ketidakseimbangan harga tiga lilin dikesan dalam kedua-dua arah di seluruh tetingkap pandangan semula anda. Setiap jurang ditapis oleh saiz pip minimum yang boleh dikonfigurasikan untuk menghapuskan bunyi. Jurang yang belum diisi memanjang ke kanan carta sehingga harga kembali untuk menutupnya, pada ketika itu ia sama ada dikeluarkan atau ditandakan sebagai terisi bergantung pada tetapan anda. Ketidakseimbangan bullish dan bearish diuruskan serentak.
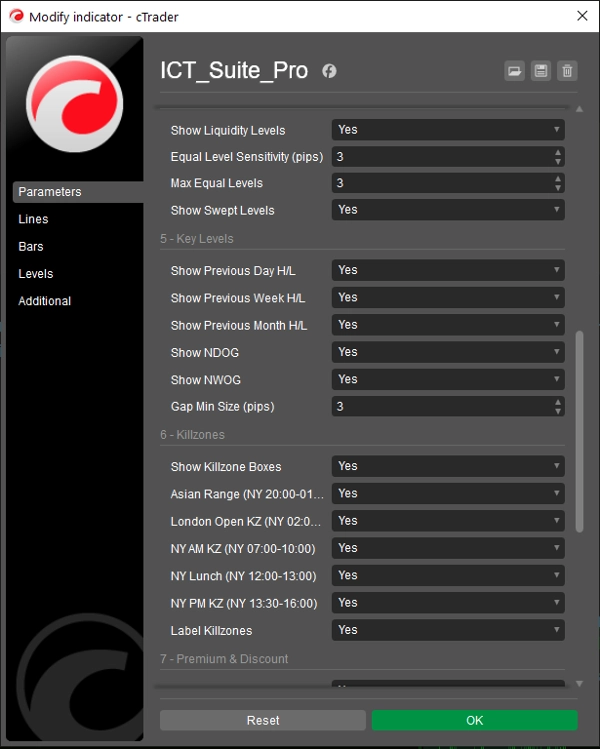
Tahap Kecairan — Tinggi Sama dan Rendah Sama
Penunjuk mengimbas untuk kelompok ayunan tinggi atau ayunan rendah yang berada dalam toleransi pip yang boleh dikonfigurasikan antara satu sama lain — mengenal pasti kolam kecairan sisi beli dan sisi jual yang biasanya menjadi sasaran aliran pesanan institusi. Setiap tahap dilukis dengan tanda tik di kedua-dua titik ayunan dan garis bertitik yang memproyeksikan ke kanan. Setelah harga melintasi tahap kecairan, ia sama ada disembunyikan atau ditandakan sebagai dilintasi bergantung pada pilihan anda.
Tahap Utama — Hari, Minggu, dan Bulan Sebelumnya
Tinggi/Rendah Hari Sebelumnya, Tinggi/Rendah Minggu Sebelumnya, dan Tinggi/Rendah Bulan Sebelumnya dikira secara automatik dari data harga carta anda sendiri. Semua sempadan tarikh diperoleh dari cap masa bar broker — bukan jam sistem tempatan anda — jadi ia kekal tepat tanpa mengira zon masa atau rollover instrumen anda. Setiap pasangan tahap menggunakan warna dan gaya garis yang berbeza supaya ia tersusun dengan kemas pada carta.
Jurang Pembukaan — Harian dan Mingguan
Penunjuk mengimbas setiap pembukaan harian dan mingguan untuk jurang harga antara penutupan sesi sebelumnya dan pembukaan sesi semasa. Sebarang jurang yang melebihi saiz pip minimum yang anda tetapkan dilukis sebagai segi empat tepat berwarna. Jurang Pembukaan Hari Baru dan Jurang Pembukaan Minggu Baru dibezakan dengan warna yang berbeza, memberikan anda bacaan segera mengenai jurang mana yang masih belum diisi.
Zon Killzone Sesi — Dengan Kotak Julat Sebenar
Tetingkap sesi Asia, Pembukaan London, New York AM, New York Lunch, dan New York PM dilukis sebagai kotak berisi yang merangkumi julat tinggi-ke-rendah sebenar yang terbentuk sepanjang setiap tempoh. Masa berdasarkan waktu New York dan secara automatik menyesuaikan untuk waktu musim panas EDT/EST. Setiap kotak boleh dihidupkan atau dimatikan secara individu dan dilabel. Oleh kerana kotak mencerminkan julat harga sebenar dan bukan garis menegak tetap, anda boleh segera melihat betapa aktifnya setiap sesi dan di mana harga mencapai ekstremnya.
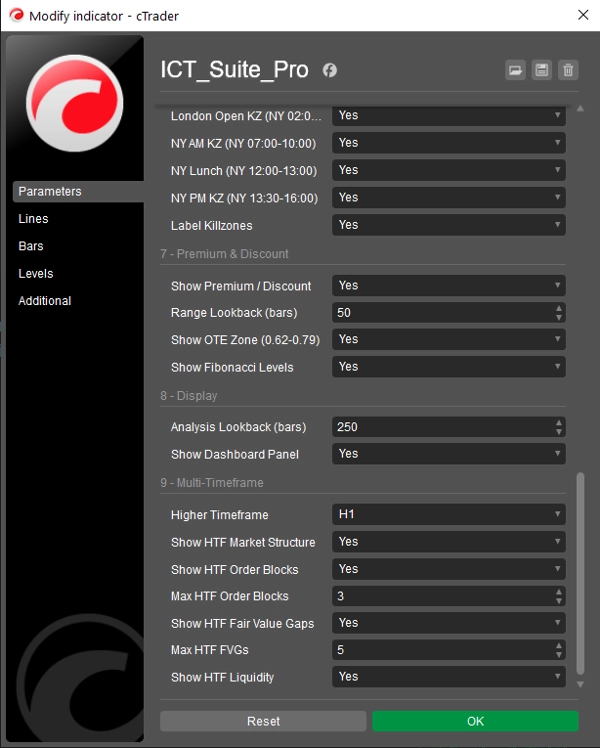
Zon Premium & Diskaun — Dengan Julat Masuk Optimum
Analisis julat bergulir mengira tinggi tertinggi dan rendah terendah sepanjang pandangan semula yang boleh dikonfigurasikan. Dari julat ini, penunjuk melukis Keseimbangan (0.50), zon masuk optimum (0.62–0.79 Fibonacci), dan set penuh tahap retracement Fibonacci utama. Label Premium dan Diskaun diletakkan di dalam julat supaya anda sentiasa tahu separuh julat dagangan semasa yang sedang didagangkan oleh harga. Pandangan semula secara automatik dikekang untuk padan dengan tetingkap bar yang kelihatan supaya tiada tahap yang merujuk kepada bar yang anda tidak dapat lihat.
Lapisan Pelbagai Jangka Masa — Ciri Menonjol
Sistem MTF membina semula lilin jangka masa lebih tinggi dengan menggabungkan bar carta semasa ke dalam slot masa yang selaras — tiada langganan data berasingan diperlukan. Pilih jangka masa lebih tinggi anda dari dropdown (M5, M15, M30, H1, H4, D1) dan Smart Money Suite Pro akan mengira dan melukis Blok Pesanan, Jurang Nilai Adil, Struktur Pasaran, dan Tahap Kecairan jangka masa lebih tinggi terus di atas carta semasa anda. Item jangka masa lebih tinggi adalah berbeza secara visual: sempadan lebih tebal, garis putus-putus, dan label yang diawali dengan tag jangka masa (contoh [H4] OB ^) supaya anda sentiasa tahu jangka masa mana tahap itu milik.
Jika anda memilih jangka masa lebih tinggi yang sama atau lebih rendah daripada jangka masa carta semasa anda — konfigurasi yang mustahil — penunjuk memaparkan amaran jelas di skrin dan tidak melukis apa-apa, mengelakkan sebarang data yang mengelirukan muncul.
Panel papan pemuka dikemas kini dengan seksyen jangka masa lebih tinggi khusus apabila lapisan aktif, menunjukkan bias HTF, kiraan blok pesanan aktif, kiraan jurang nilai adil, dan kiraan tahap kecairan bersama ringkasan jangka masa semasa.
Papan Pemuka Langsung
Panel bersih yang dipasang di sebelah kanan memaparkan: bias pasaran semasa, sesi perdagangan aktif, waktu New York, kiraan semua blok pesanan aktif, blok pemecah, jurang nilai adil, dan tahap kecairan, serta jumlah pecahan BOS dan CHoCH yang dikesan dalam tetingkap pandangan semula. Apabila lapisan pelbagai jangka masa diaktifkan, ringkasan jangka masa lebih tinggi ditambah secara automatik di bawah.
Dibina untuk Perdagangan Langsung
Penunjuk hanya melukis semula apabila bar baru terbentuk — bukan pada setiap tick masuk — menghapuskan kelipan carta yang menjejaskan banyak penunjuk serba boleh. Semua analisis dijalankan dalam tetingkap pandangan semula yang boleh dikonfigurasikan supaya prestasi kekal konsisten walaupun pada jangka masa lebih rendah dengan bilangan bar yang besar.
Ringkasan
SMC-Pro features premium and discount zones derived from Fibonacci retracement levels within a rolling price range, aiding optimal entry identification. A standout multi-timeframe overlay reconstructs higher timeframe candles and displays their corresponding order blocks, fair value gaps, market structure, and liquidity levels directly on the current chart, with clear visual distinctions and a dashboard summary of both current and higher timeframe data.
The indicator is optimized for live trading with efficient redraws only on new bars to prevent flicker and maintains performance via a configurable lookback window. It supports various markets including Forex, indices, and cryptocurrencies such as BTCUSD and XAUUSD.
Ulasan pelanggan
5 | 50 % | |
4 | 50 % | |
3 | 0 % | |
2 | 0 % | |
1 | 0 % |


![Logo "[Stellar Strategies] Inside Bar with Signals"](https://cdn.ctrader.com/image/webp/1d9e8bfa-3b2c-4440-bb37-5856902008a7_30683)


