
Описание
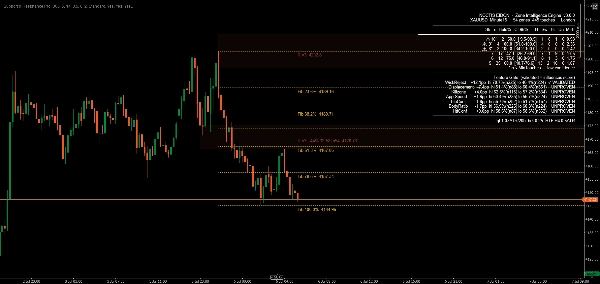
Support & Resistance Pro определяет зоны поддержки и сопротивления и — в отличие от большинства инструментов S/R — измеряет, действительно ли эти зоны работают, используя независимый статистический движок, основанный на реальных исторических данных, а не на предположениях. Каждая зона показывает статистику удержания с доверительным интервалом, рассчитанным на основе полного исторического населения зон, включая зоны, которые позже были пробиты и исчезли с графика. Большинство индикаторов в этой категории учитывают только уровни, видимые сегодня, что тихо завышает каждое утверждение о силе. Этот инструмент этого не делает.
Ключевые особенности
- Статистически подтвержденные зоны Каждая зона имеет реальный, исторически измеренный коэффициент удержания с 95% доверительным интервалом — а не предполагаемый показатель силы. Один сигнал, отторжение фитиля в точке контакта, был формально подтвержден: проверен на EURUSD и Bitcoin, на нескольких таймфреймах, включая настоящий тест на данных вне выборки, где эффект сохранял силу на невидимых данных.
- Автоматическая смена ролей Пробитая поддержка автоматически становится сопротивлением и наоборот, с четким визуальным маркером — индикатор отслеживает, с какой стороны цены находится зона, и окрашивает её соответственно, а не фиксирует цвет по тому, как зона изначально сформировалась.
- Конфлюенс с таймфреймом выше Зоны на вашем графике проверяются по выбранному вами более высокому таймфрейму, с совпадающей структурой HTF, отображаемой непосредственно на графике в виде отдельного визуального наложения.
- Интеграция уровней Фибоначчи Автоматические уровни коррекции Фибоначчи от последнего свинга, каждый с подписью как коэффициента, так и точной цены с точностью вашего брокера, автоматически упорядоченные относительно соседних зон, чтобы метки никогда не перекрывались.
- Предупреждение о насыщении Зоны, проверенные слишком много раз, отмечаются, а не считаются сильнее — наши данные показывают, что сильно проверенные зоны обычно работают хуже, вероятно, потому что их доступная ликвидность уже исчерпана.
- Открытый валидирующий механизм Шесть дополнительных кандидатных сигналов — соотношение тела, скорость подхода, время сессии/killzone и тестирование смещения — отображаются в реальном времени на встроенной панели статистики с собственными показателями удержания. Они не влияют на какой-либо рейтинг или оценку, пока каждый из них независимо не пройдет тот же порог доказательств, что и отторжение фитиля. Вы видите точно, что доказано, а что нет.
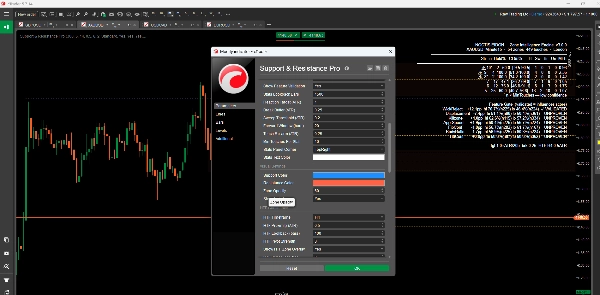
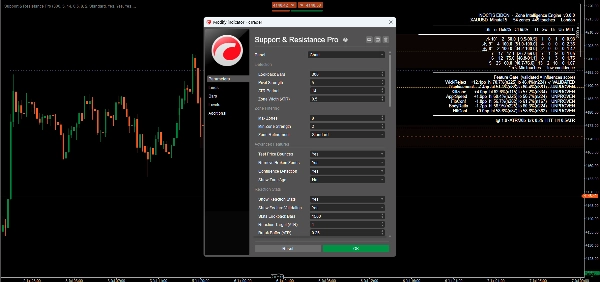
- Настраиваемые параметры Широкий контроль параметров по чувствительности обнаружения, фильтрации зон, визуальному стилю и поведению оповещений.
- Оповещения в реальном времени Настраиваемые всплывающие окна, email и звуковые оповещения о касаниях зон, пробоях и событиях конфлюенса, с возможностью независимого включения для каждого канала.
Преимущества
- Доказательства вместо предположений: каждая статистика на графике может быть проверена независимо — индикатор включает собственные инструменты верификации на выборке и вне выборки
- Отсутствие смещения выживших: утверждения о силе основаны на полном историческом населении зон, а не только на уровнях, которые случайно сохранились
- Честное раскрытие информации: доказанные и недоказанные сигналы всегда помечены соответствующим образом на графике
Идеально подходит для
Трейдеров, которые хотят видеть статистические доказательства за уровнем, а не просто линию — дей-трейдеров, свинг-трейдеров и систематических трейдеров на рынке форекс, криптовалют и других инструментах, ищущих строго измеренный подход к поддержке и сопротивлению.
Заключение
Support & Resistance Pro построен на одном принципе: утверждение о силе не является реальным, пока оно не измерено. Один сигнал преодолел этот порог с подтверждением на разных инструментах, таймфреймах и вне выборки. Остальные честно показываются как ещё тестируемые — потому что число, которое вы не можете проверить, не стоит показывать вообще.
Сводка
- Dynamic support and resistance levels that adjust in real-time based on recent price action.
- Multi-timeframe analysis to view levels across different timeframes for a comprehensive market overview.
- Calculation and display of pivot points to mark potential intraday reversal zones and target prices.
- Highlighting of psychological price levels (round numbers) to gauge market sentiment.
- Integration of Fibonacci retracement levels to assist in identifying support and resistance during price corrections.
- Customizable settings for lookback periods, visualization styles, and color schemes to suit individual trading preferences.
- Clear graphical representation for easy identification of market conditions.
- Configurable real-time alerts when prices approach critical levels.
This indicator supports various trading styles including scalping, day trading, and swing trading, and is suitable for traders in forex, commodities, stocks, and indices markets. It is intended for both beginner and experienced traders seeking structured market analysis and enhanced decision-making through reliable support and resistance data.
Отзывы покупателей
5 | 100 % | |
4 | 0 % | |
3 | 0 % | |
2 | 0 % | |
1 | 0 % |


