
Описание
SmartFibonacci — автоматические, настраиваемые уровни Фибоначчи для откатов и расширений с поддержкой старших таймфреймов, ценовыми метками и оповещениями о приближении для более быстрых и уверенных торговых решений.
Краткое описание для магазина (1–2 строки)
SmartFibonacci автоматически определяет точки максимума/минимума колебаний и рисует четкие уровни откатов Фибоначчи и опциональные расширения на вашем графике. Настраиваемый период поиска, обнаружение колебаний на старших таймфреймах, ценовые/процентные метки и оповещения о приближении делают его идеальным как для внутридневного скальпинга, так и для свинг-трейдинга.
Полное описание продукта (готовое для копирования в cTrader Store)
SmartFibonacci — это легкий индикатор для cTrader с акцентом на производительность, который автоматизирует анализ Фибоначчи, позволяя тратить меньше времени на рисование уровней и больше — на торговлю. Он находит самый последний максимум и минимум колебания в настраиваемом периоде, рисует уровни откатов и опциональные уровни проекции (расширения), а также отображает ценовые и процентные метки для быстрого восприятия. Для надежных сигналов SmartFibonacci может вычислять точки колебаний на старшем таймфрейме, отображая уровни на текущем графике. Встроенные оповещения (всплывающее окно + звук) уведомляют вас, когда цена подходит на настраиваемое расстояние в пунктах к любому видимому уровню Фибоначчи.
В этом списке представлены: четкие скриншоты с ключевыми элементами интерфейса, примеры рабочих процессов, настройки конфигурации и примеры вывода (ценовые метки, расширения, оповещения), чтобы покупателям было проще оценить функциональность и удобство использования перед покупкой.
Ключевые особенности
- Автоматическое обнаружение колебаний — находит самый последний максимум/минимум колебания в настраиваемом окне поиска.
- Опция старшего таймфрейма для колебаний — вычисляет поворотные точки колебаний на старшем таймфрейме для более плавных и значимых уровней.
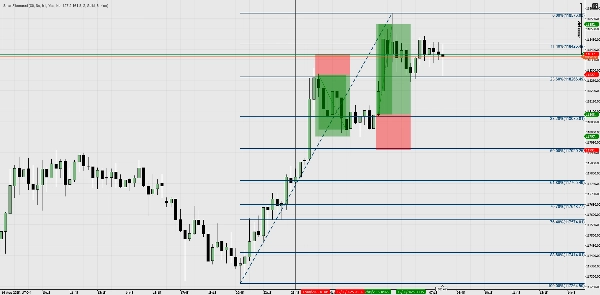
- Откаты и расширения — рисует стандартные линии откатов и опциональные уровни проекции (расширения) (проценты, задаваемые пользователем, например 127.2, 161.8 и др.).
- Ценовые и процентные метки — каждый видимый уровень показывает свой процент и точную цену для быстрого принятия решений.
- Настраиваемый внешний вид — задавайте цвета (откат / расширение), толщину и стиль линий.
- Оповещения о приближении — всплывающее окно + звук при приближении цены на настраиваемое расстояние в пунктах к видимому уровню Фибоначчи; опция оповещать только о ближайшем уровне.
- Эффективная логика перерисовки — индикатор перерисовывается только при изменении поворотных точек колебаний, чтобы уменьшить загромождение графика и нагрузку на процессор.
- Безопасные настройки по умолчанию — разумные значения по умолчанию для трейдеров, желающих сразу начать работу после установки.
- Совместимость с cTrader / cAlgo — разработан для работы как индикатор-оверлей.
Настройка (параметры и объяснения)
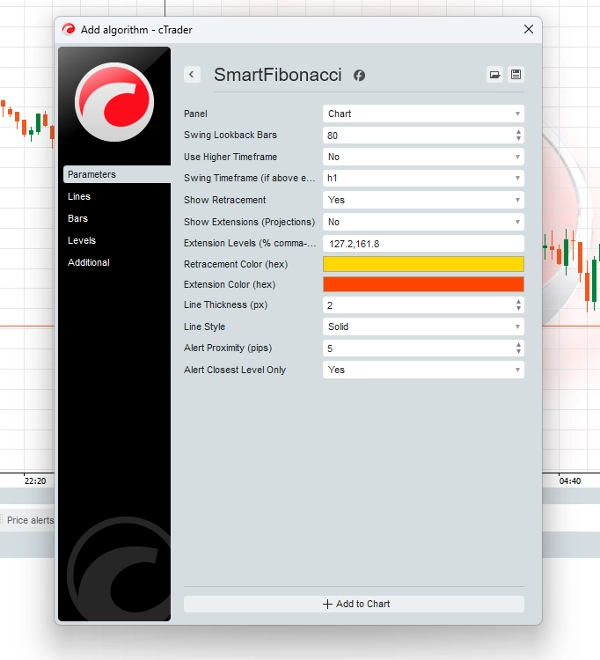
- Swing Lookback Bars (int) — сколько баров назад искать максимум/минимум колебания (по умолчанию 80).
- Use Higher Timeframe (bool) — включить обнаружение на старшем таймфрейме при рисовании на текущем графике.
- Swing Timeframe (TimeFrame) — старший таймфрейм, используемый при включенной опции
Use Higher Timeframe. - Show Retracement (bool) — включить/выключить рисование уровней откатов.
- Show Extensions (bool) — включить/выключить рисование уровней расширений/проекций.
- Extension Levels (string) — значения процентов через запятую (например,
127.2,161.8) для построения линий проекции. - Retracement Color / Extension Color (hex) — выбор цветов для линий откатов и расширений.
- Line Thickness (px) — настройка толщины линий (целое число).
- Line Style (enum) — выбор стиля линий: сплошные, пунктирные и т.д.
- Alert Proximity (pips) — расстояние в пунктах для оповещений о приближении.
- Alert Closest Level Only (bool) — при включении оповещается только ближайший уровень Фибоначчи.
Аналитические выводы и элементы UX
- Линии на графике — линии откатов и расширений с четкими процентными метками (например, 61.8%) и ценовыми метками (например, 1.23456).
- Всплывающие уведомления — пользователь получает всплывающее окно и системный звук, когда цена входит в область
Alert Proximity. - Ненавязчивая перерисовка — обновления происходят только при изменении обнаруженных колебаний, чтобы избежать частого мерцания перерисовки.
- Согласованность источника цены — оповещения и метки рассчитываются с использованием той же серии баров, на которой построены уровни Фибоначчи (важно при использовании расчетов на старшем таймфрейме).
Примеры рабочих процессов / сценарии использования
- Быстрая настройка (скальпинг / внутридневная торговля)
-
- Подключите SmartFibonacci к 5-минутному графику, установите
Lookback = 80,ShowRetrace = true. - Следите за уровнями откатов и используйте 61.8% / 50% как внутридневные зоны реакции.
- Включите
Alert Proximity = 5 pips, чтобы получать уведомления при приближении цены к важным уровням.
- Подключите SmartFibonacci к 5-минутному графику, установите
- Контекст старшего таймфрейма (свинг-трейдинг)
-
- Установите
Use Higher Timeframe = trueи выберитеHigher Timeframe = H4(или Daily). - Уровни отражают колебания H4, пока вы торгуете на H1 или M30 — лучшее согласование со структурой старшего таймфрейма.
- Используйте расширения (127.2, 161.8) как цели прибыли для свинг-сделок.
- Установите
- Валидация + конвергенция
-
- Комбинируйте уровни SmartFibonacci с вашими существующими уровнями поддержки/сопротивления, пробоями структуры или скользящими средними для подтверждения входов.
- Используйте всплывающие оповещения для точного тайминга входов или ведите журнал взаимодействий для бэктестинга.
- Рабочие процессы, основанные на оповещениях
-
- Держите индикатор включенным при мониторинге нескольких графиков; получайте всплывающие окна, когда цена приближается к любому настроенному видимому уровню Фибоначчи, и действуйте соответственно.
Сводка
Отзывы покупателей
5 | 100 % | |
4 | 0 % | |
3 | 0 % | |
2 | 0 % | |
1 | 0 % |


