
Описание
ZigzagSR – Динамические зигзагообразные колебания с автоматической поддержкой и сопротивлением
Откройте для себя более четкую структуру рынка и точные зоны входа с ZigzagSR, мощным индикатором cTrader, который:
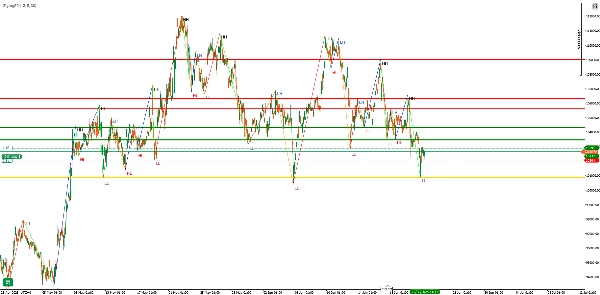
- Строит незакрашивающиеся зигзагообразные колебания (высшие максимумы, нижние максимумы, высшие минимумы, нижние минимумы) в реальном времени
- Автоматически рисует динамические уровни поддержки и сопротивления на основе последних пивотных колебаний
- Обозначает каждую точку колебания («HH», «LH», «HL», «LL») для мгновенного понимания тренда
Ключевые особенности
- Адаптивное обнаружение зигзага
-
- Настраиваемые Depth, Deviation и Backstep параметры для точной настройки чувствительности к рыночному шуму
- Логика без перерисовки гарантирует стабильность исторических сигналов после их построения
- Автоматические уровни поддержки и сопротивления
-
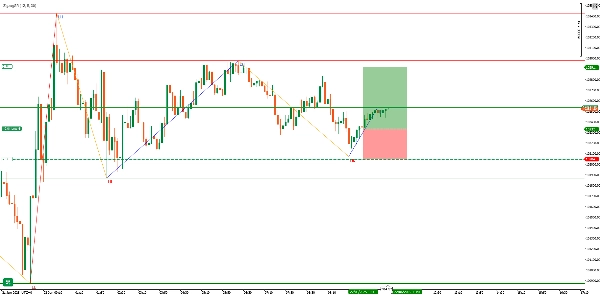
- Рисует пивотную линию в последней действительной точке колебания (золотая линия)
- Выделяет до трех последних максимумов сопротивления (красные линии) и три минимума поддержки (зеленые линии) перед пивотом
- Линии обновляются плавно по мере формирования новых колебаний, поддерживая чистоту графика
- Четкие визуальные метки
-
- «HH» (высший максимум) и «LH» (нижний максимум) для медвежьих/высоких пиков
- «HL» (высший минимум) и «LL» (нижний минимум) для бычьих/низких впадин
- Цветовые сегменты зигзага:
-
- HH → Лайм
- LH → Оранжевый
- HL → Синий
- LL → Красный
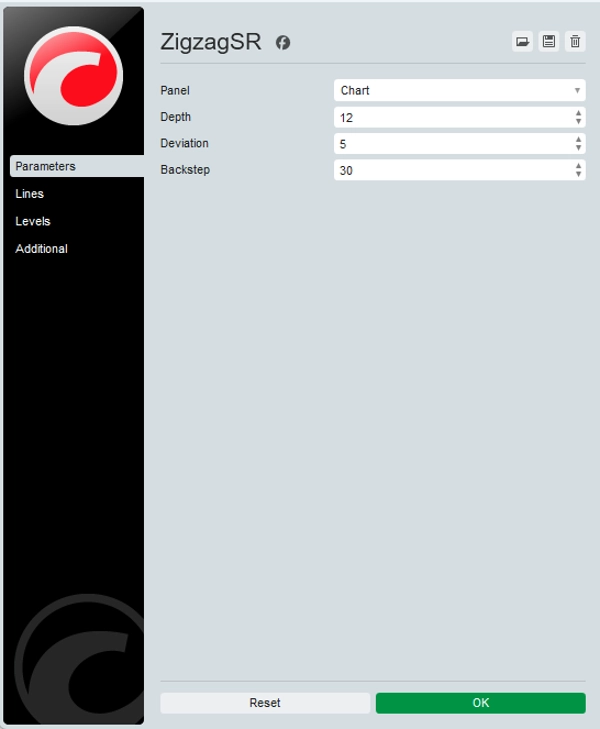
Входные данные и настройка
ПараметрПо умолчаниюОписание
Depth
12
Количество баров для определения локальных максимумов/минимумов
Deviation
5
Минимальное движение цены (в тиках) для учета колебания
Backstep
3
Количество баров для «отката» с целью подавления ложных пивотов
Совет: Увеличьте Depth и Deviation на старших таймфреймах для фильтрации шума; уменьшите их на M1/M5 для чувствительности.
Почему стоит использовать ZigzagSR?
- Подтверждение тренда: Четко различайте импульсные колебания и коррекционные движения — идеально для свинг- и прорывных трейдеров.
- Зоны входа SR: Автоматически отмеченные уровни помогают точно определить зоны входа, стоп-лосса и тейк-профита без ручного рисования линий.
- Разработка стратегии: Метки и линии напрямую интегрируются в советники/cBots или ручные системы — создавайте последовательные, основанные на правилах настройки.
Как это работает
- Картирование максимумов/минимумов
-
- Сканирует бары за последние
Depthпериодов для выявления локальных экстремумов (_highMapи_lowMap).
- Сканирует бары за последние
- Построение колебаний
-
- Чередует бычьи и медвежьи состояния, добавляя в список колебаний только значимые пивоты.
- Назначение меток
-
- Сравнивает каждый пивот с предыдущим, чтобы пометить его как HH/LH или HL/LL.
- Рисование уровней поддержки и сопротивления
-
- Определяет последний пивот как «пивотную линию», затем отображает три предыдущих действительных максимума и минимума как уровни сопротивления/поддержки.
- Отрисовка зигзага
-
- Соединяет все точки колебаний цветными трендовыми линиями и накладывает текстовые метки с небольшим смещением для ясности.
Сценарии использования и советы
- Свинг-трейдинг: Следуйте за многобарными импульсами — входите на откатах к пивотной линии, ставьте цель на следующий уровень поддержки/сопротивления.
- Подтверждение прорыва: Ждите, пока цена пробьет линию сопротивления, нарисованную ZigzagSR, затем подтверждайте сигнал объемом или RSI.
- Наложение с другими индикаторами: Комбинируйте с скользящими средними, дивергенциями RSI или профилями объема для усиления сигналов.
Начните за секунды:
- Установите ZigzagSR из cTrader Store.
- Добавьте его на любой график — внешние библиотеки не требуются.
- Настройте три входных параметра под ваш предпочтительный таймфрейм и стиль стратегии.
Повышайте качество анализа графиков с помощью структуры колебаний в реальном времени и динамических уровней поддержки и сопротивления — попробуйте ZigzagSR уже сегодня!
Сводка
Отзывы покупателей
5 | 33 % | |
4 | 67 % | |
3 | 0 % | |
2 | 0 % | |
1 | 0 % |


![Логотип продукта "[Stellar Strategies] Market Session Ultimate"](https://cdn.ctrader.com/image/webp/61ffd537-0125-4246-9e72-42eca1791d64_28232)


