
Описание
Улучшенный индикатор поддержки и сопротивления
Откройте для себя возможности технического анализа с нашим Улучшенным индикатором поддержки и сопротивления для cAlgo. Этот продвинутый инструмент предназначен для помощи трейдерам в выявлении и визуализации критических уровней поддержки и сопротивления на торговых графиках, улучшая принятие решений и торговые стратегии.
Основные характеристики:
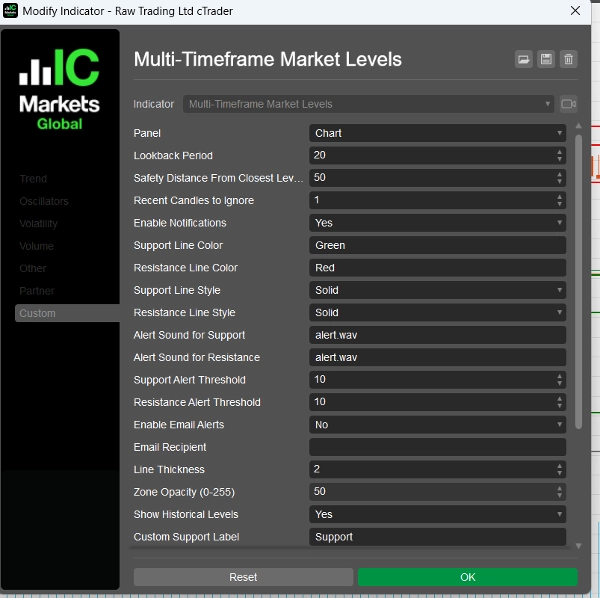
- Настраиваемые параметры: Настройте индикатор под свой стиль торговли с помощью регулируемых параметров, включая периоды обратного просмотра, безопасные расстояния, звуки оповещений и многое другое.
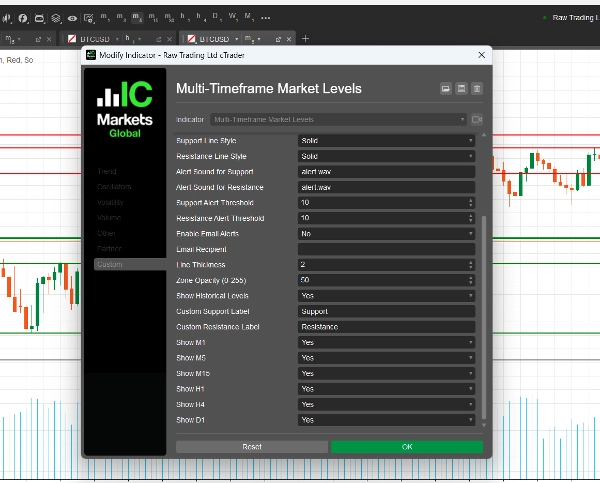
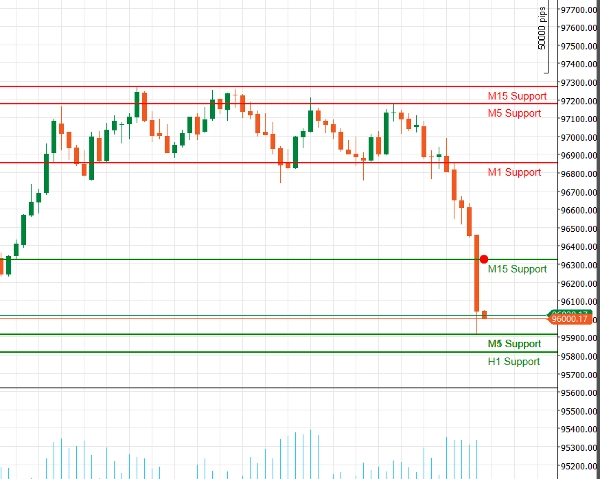
- Поддержка нескольких таймфреймов: Анализируйте несколько таймфреймов одновременно (M1, M5, M15, H1, H4, D1), чтобы получить всестороннее представление о динамике рынка и выявить ключевые уровни на разных торговых горизонтах.
- Оповещения в реальном времени: Будьте в курсе с мгновенными уведомлениями! Индикатор может отправлять звуковые сигналы и электронные письма, когда цена приближается к критическим уровням поддержки или сопротивления, гарантируя, что вы не пропустите торговую возможность.
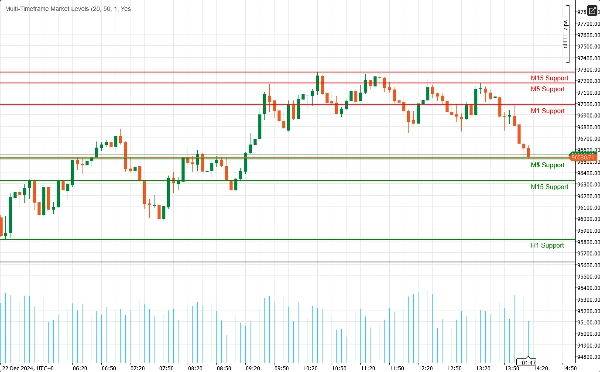
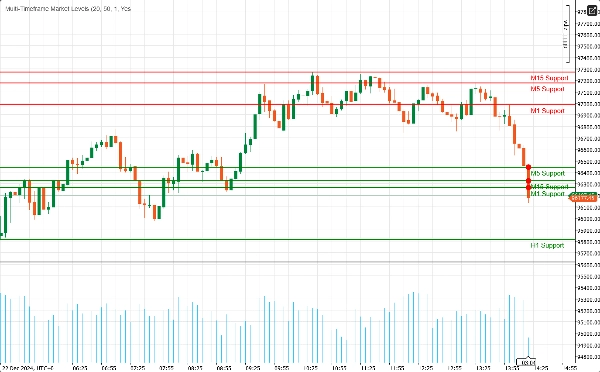
- Визуальная ясность: Наслаждайтесь четким визуальным отображением уровней поддержки и сопротивления с настраиваемыми цветами и стилями линий. Выделенные зоны предоставляют дополнительный контекст, облегчая выявление потенциальных точек разворота.
- Интеграция с Фибоначчи: Улучшите свой анализ с помощью встроенного построения уровней Фибоначчи, позволяющего выявлять потенциальные уровни коррекции и расширения вместе с поддержкой и сопротивлением.
- Удобный интерфейс: Разработан как для новичков, так и для опытных трейдеров, индикатор легко настраивается и бесшовно интегрируется в вашу существующую среду cAlgo.
Как использовать Улучшенный индикатор поддержки и сопротивления
- Установка:
-
- Скачайте индикатор и импортируйте его в вашу платформу cAlgo.
- Прикрепите индикатор к нужному графику.
- Настройка параметров:
-
- Отрегулируйте настройки под свой стиль торговли. Установите период обратного просмотра, безопасное расстояние и выберите предпочитаемые цвета и стили линий для уровней поддержки и сопротивления.
- Включите уведомления, если хотите получать оповещения при приближении цены к этим уровням.
- Выбор таймфреймов:
-
- Выберите таймфреймы, которые хотите отображать. Вы можете показать или скрыть уровни с M1, M5, M15, H1, H4 и D1 в зависимости от вашей торговой стратегии.
- Анализ графика:
-
- Наблюдайте за уровнями поддержки и сопротивления, нанесёнными на ваш график. Эти уровни указывают, где цена, вероятно, развернётся или консолидируется.
Как торговать с помощью Улучшенного индикатора поддержки и сопротивления
- Определение точек входа:
-
- Длинные позиции: Ищите возможности для покупки, когда цена приближается к уровню поддержки, особенно если наблюдаются признаки отскока (например, бычьи свечные модели).
- Короткие позиции: Рассмотрите возможность продажи, когда цена приближается к уровню сопротивления, особенно если есть медвежьи сигналы (например, медвежьи свечные модели).
- Использование оповещений:
-
- Используйте оповещения в реальном времени, чтобы получать уведомления, когда цена приближается к ключевым уровням поддержки или сопротивления. Это позволяет быстро реагировать и использовать потенциальные торговые возможности.
- Комбинирование с другими индикаторами:
-
- Улучшите свою стратегию, сочетая Улучшенный индикатор поддержки и сопротивления с другими техническими индикаторами (например, скользящими средними, RSI, MACD) для подтверждения сигналов и повышения точности сделок.
- Установка уровней стоп-лосс и тейк-профит:
-
- Размещайте ордера стоп-лосс чуть ниже уровней поддержки для длинных позиций и чуть выше уровней сопротивления для коротких позиций, чтобы управлять рисками.
- Устанавливайте цели тейк-профит на следующем значимом уровне поддержки или сопротивления, чтобы максимизировать потенциальную прибыль.
Почему стоит выбрать Улучшенный индикатор поддержки и сопротивления?
Навигация по сложностям финансовых рынков может быть непростой задачей. Улучшенный индикатор поддержки и сопротивления предоставляет вам инструменты, необходимые для выявления ключевых ценовых уровней и принятия обоснованных торговых решений. Независимо от того, являетесь ли вы дневным трейдером или долгосрочным инвестором, этот индикатор станет незаменимым дополнением к вашему торговому арсеналу.
Сводка
Отзывы покупателей
5 | 100 % | |
4 | 0 % | |
3 | 0 % | |
2 | 0 % | |
1 | 0 % |


