
Описание
/* ===========================================================================
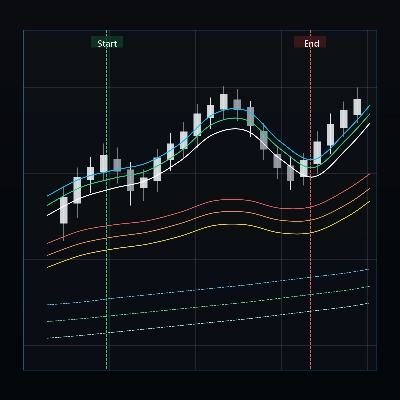
Индикатор: MultiTimeframeMA
Автор: Christian
---------------------------------------------------------------------------
Особенности:
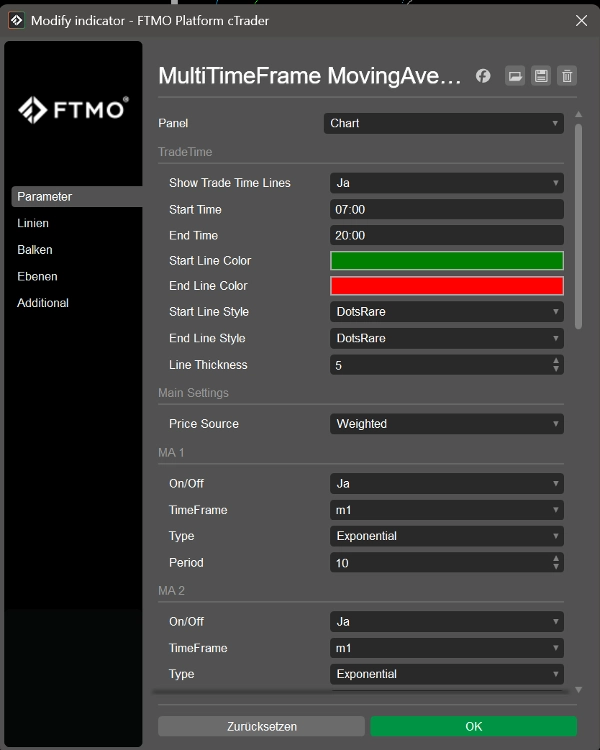
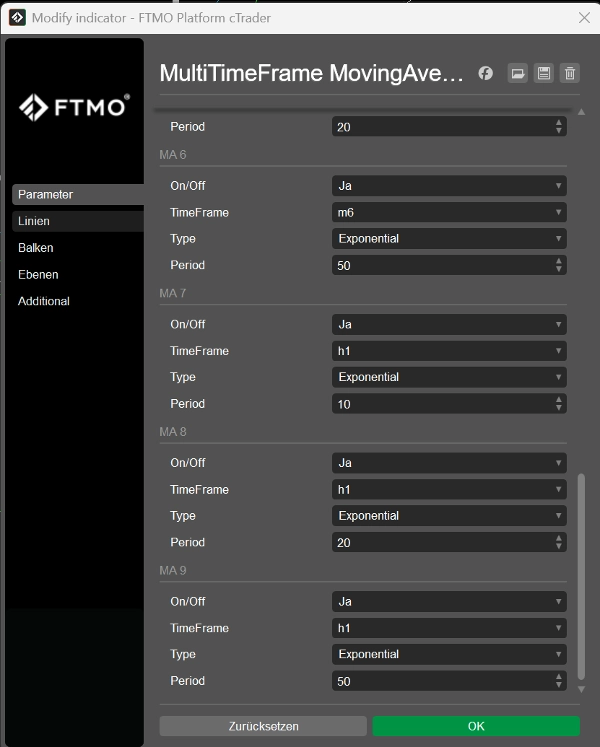
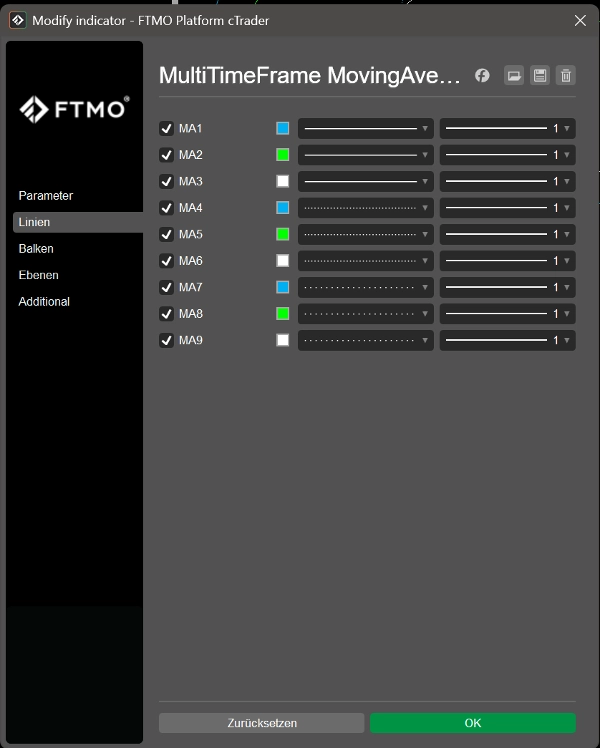
- До 9 скользящих средних с индивидуальным таймфреймом, типом и периодом
- Поддерживаемые типы MA: SMA, EMA, WMA, LWMA, HMA
- Поддерживаемые источники цены: Close, Open, High, Low, HL2, HLC3, OHLC4, Median, Typical, Weighted
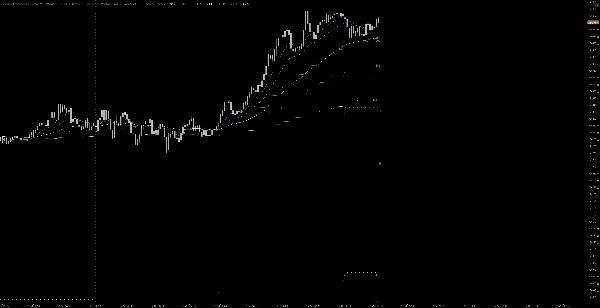
- Отображается непосредственно на графике (Overlay)
- Цвета/стили/толщина MA регулируются через вкладку Lines
Дополнительная функция: линии сессии TradeTime
- Две вертикальные линии для времени начала и окончания (HH:mm)
- Цвет, стиль линии и толщина полностью настраиваемы
- Может быть включено/выключено через параметр
Версия: V1.14 (Стабильная)
Примечания:
- HTF-MA отображаются ступенчато по умолчанию (реальные значения)
-> Интерполяция не применяется для сохранения точности
=========================================================================== */
Сводка
Отзывы покупателей
5 | 33 % | |
4 | 67 % | |
3 | 0 % | |
2 | 0 % | |
1 | 0 % |


![Логотип продукта "[Stellar Strategies] MARSI Signal Plotter"](https://cdn.ctrader.com/image/webp/7b2b8da6-8f8e-4646-8d4a-4710c516c01e_25567)

