
Описание
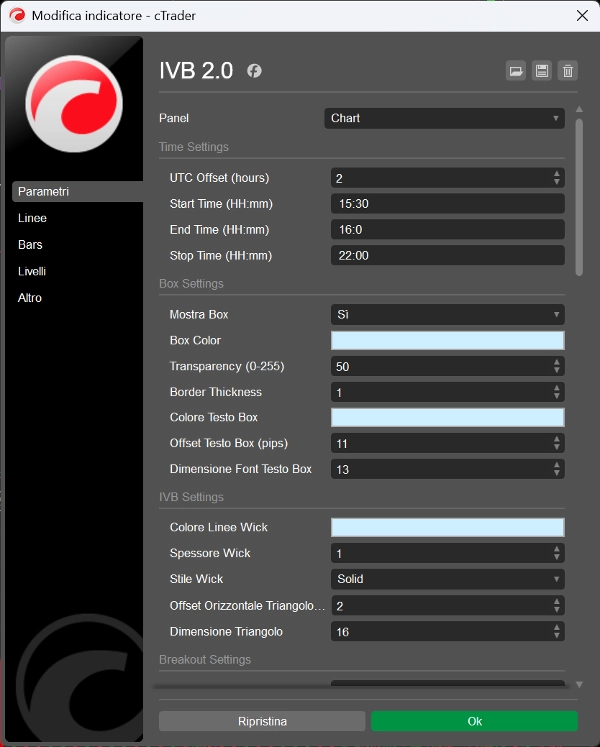
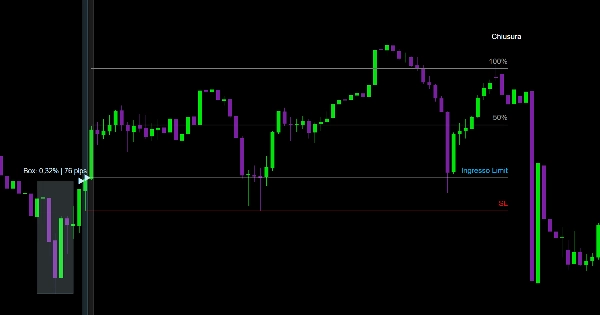
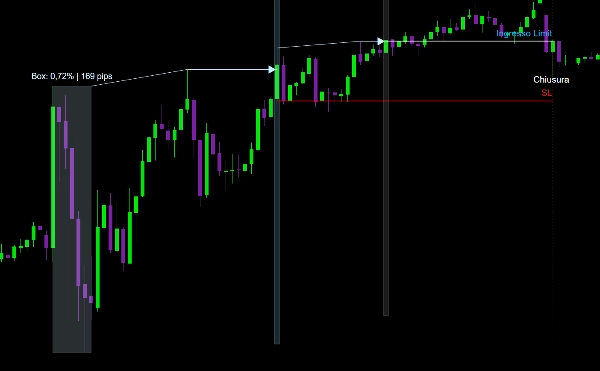
После определения временного диапазона для создания коробки волатильности индикатор показывает пробои, предоставляет точки входа (Limit или Market), размещение Stop Loss и уровни Take Profit на проекциях 50%/100%/200%, когда эта коробка становится несбалансированной, полностью настраиваемый: вы можете включать или отключать каждую функцию и настраивать цвета по своему усмотрению.
Этот индикатор предназначен для таймфрейма 5 минут.
Сводка
ИИ-сводка
IVB 2.0 is a trading indicator designed for use on a 5-minute timeframe, focusing on the imbalance within the maximum volatility box of indices. Users define a time range to create this volatility box, after which the indicator signals breakouts and suggests entry points using limit or market orders. It also provides guidance for placing Stop Loss and Take Profit levels at 50%, 100%, and 200% projections once the volatility box becomes imbalanced. The indicator is fully customizable, allowing users to enable or disable individual features and adjust color settings according to their preferences.
Профиль индикатора
Отзывы покупателей
4.3
Отзывы: 3
5 | 33 % | |
4 | 67 % | |
3 | 0 % | |
2 | 0 % | |
1 | 0 % |
Отзывы покупателей
September 14, 2025
September 11, 2025
the first 10 trades should stay boring. The review process gets less scattered.
August 31, 2025
Обсуждение
Частые вопросы
Продукты, доступные в cTrader Store, включая торговых ботов, индикаторы и плагины, предоставляются сторонними разработчиками и доступны исключительно в информационных и технических целях. cTrader Store не является брокером и не предоставляет инвестиционные консультации, персональные рекомендации или какие-либо гарантии будущей доходности.


Цена
С 20/08/2025
1
Продажи