
Weekly Daily Levels
Индикатор
2 покупки
Версия 1.0, Aug 2025
Windows, Mac
5.0
Отзывы: 2
Описание
Вы полагаетесь на ежедневные и еженедельные цены OHLC и средние значения в своей торговой стратегии? Устали отмечать их вручную каждый раз, когда совершаете сделку?
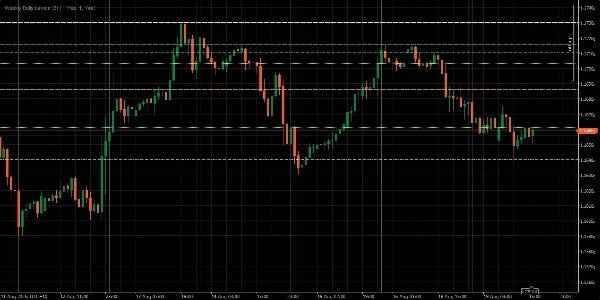
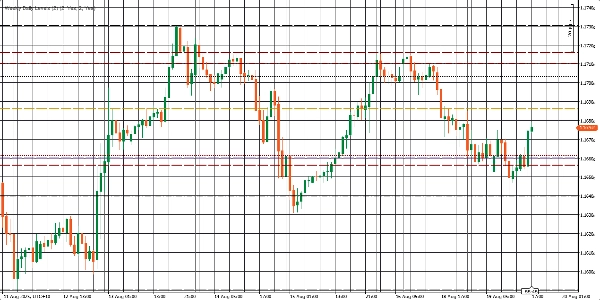
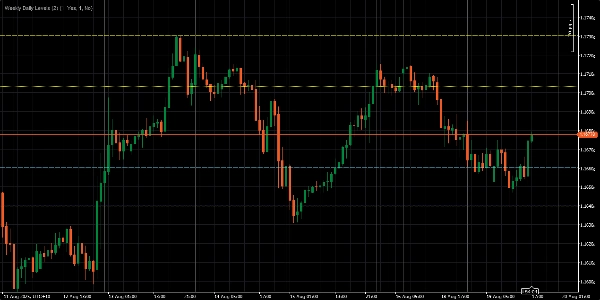
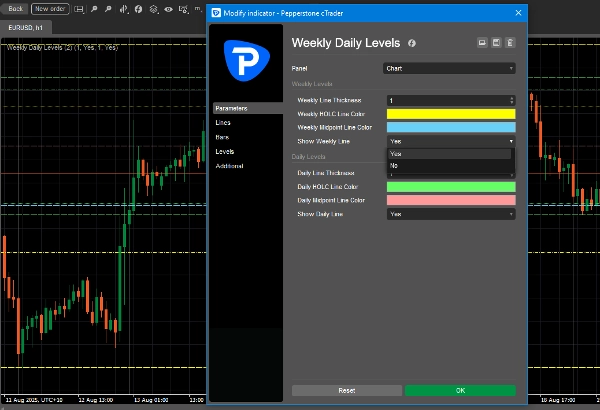
Индикатор Weekly Daily Levels выполняет всю тяжелую работу за вас. Он автоматически отображает цены открытия, максимума, минимума, закрытия (OHLC) и средние значения за предыдущий день и предыдущую неделю прямо на вашем графике. Это значит, что вы можете сосредоточиться на выполнении своей стратегии, пока индикатор заботится о деталях — делая вашу торговлю проще, быстрее и гораздо эффективнее.
Ключевые особенности:
- Мгновенно отображает ежедневные и еженедельные цены OHLC и средние значения.
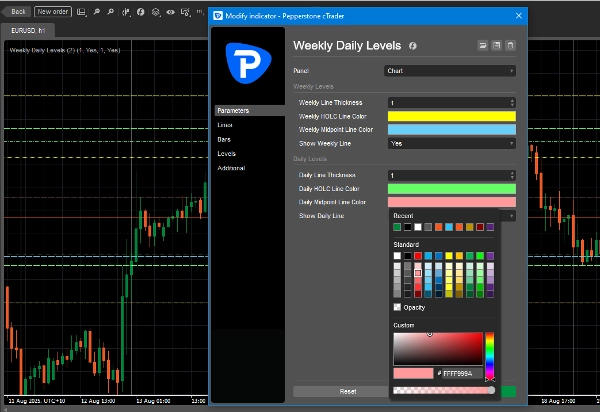
- Настраивайте цвета линий в соответствии с вашим стилем графика.
- Включайте или отключайте дневные или недельные уровни одним кликом.
- Регулируйте толщину линий для лучшей видимости.
Сводка
ИИ-сводка
The Weekly Daily Levels indicator automatically plots the previous day’s and previous week’s open, high, low, close (OHLC) prices along with their mid-points directly on trading charts. It provides instant visual reference to these key price levels, helping traders incorporate daily and weekly price data into their strategies without manual marking. Users can customize line colors and thickness to fit their chart style and toggle daily or weekly levels on or off with a single click. This indicator streamlines the process of tracking important historical price levels for improved trading efficiency.
Профиль индикатора
Отзывы покупателей
5.0
Отзывы: 2
5 | 100 % | |
4 | 0 % | |
3 | 0 % | |
2 | 0 % | |
1 | 0 % |
Отзывы покупателей
August 28, 2025
Not bad if the rules are already clear. Two timeframes give more context.
August 21, 2025
the good surprise is the setup needs less second guessing, and It works better with a written plan.
Обсуждение
Частые вопросы
Продукты, доступные в cTrader Store, включая торговых ботов, индикаторы и плагины, предоставляются сторонними разработчиками и доступны исключительно в информационных и технических целях. cTrader Store не является брокером и не предоставляет инвестиционные консультации, персональные рекомендации или какие-либо гарантии будущей доходности.


Цена
С 19/04/2025
2
Продажи