

present
注册即可在首次购物时获得 $50 优惠
Trading product for Impulse Heatmap 指标 EMA Key Levels, image 1
Impulse Heatmap
指标
版本 1.0, Aug 2026
Windows 版、Mac 版
Trading product for Impulse Heatmap 指标 EMA Key Levels, image 2
Trading product for Impulse Heatmap 指标 EMA Key Levels, image 3
Trading product for Impulse Heatmap 指标 EMA Key Levels, image 4
Trading product for Impulse Heatmap 指标 EMA Key Levels, image 5
注册日期 07/05/2026
5
销售
63
免费安装

说明

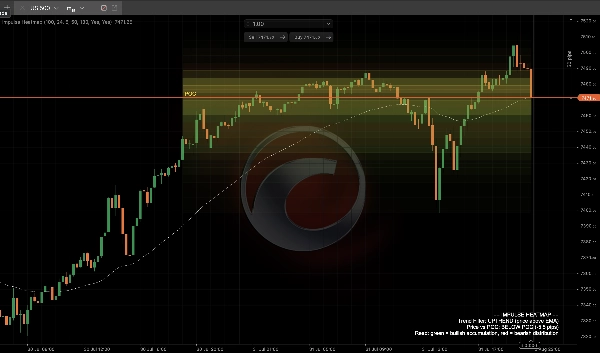
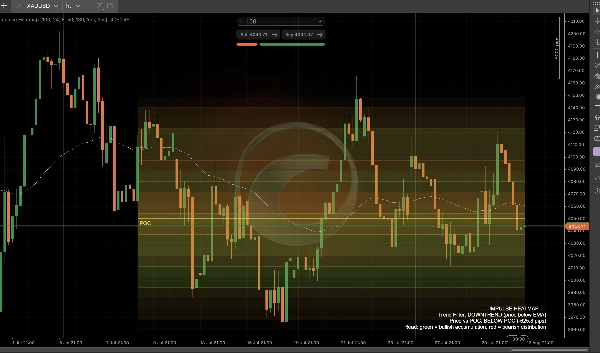
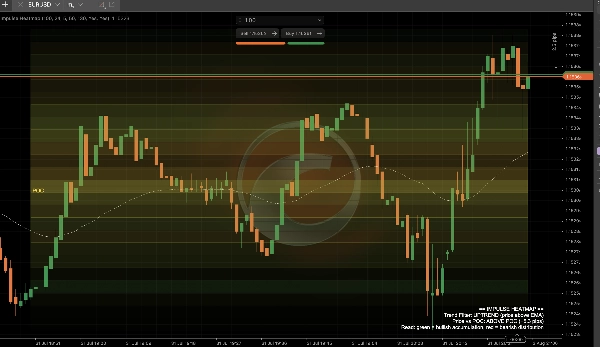
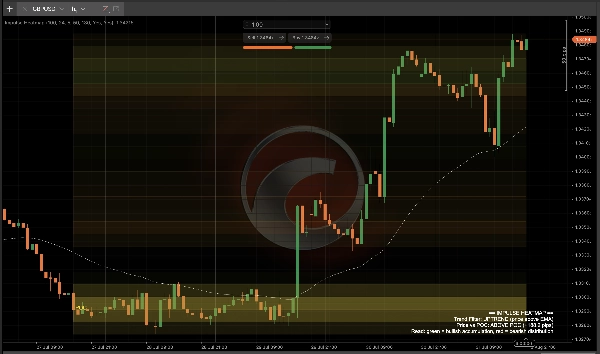
成交量热图现在随处可见,但几乎所有热图显示的都是同样的内容:仅显示强度,单一颜色,没有体现该成交量是买入还是卖出。Impulse Heatmap 补充了缺失的部分——每个价格区间不仅按密度着色,还按方向进行颜色混合,这样你可以一眼区分积累和分配。

它分析的内容: 滚动回溯窗口内的成交量,按标准成交量分布的方式分配到价格区间——但每个区间的颜色是该价格处多头收盘蜡烛与空头收盘蜡烛成交量比例的混合。主要是多头成交量的区域呈绿色(积累);主要是空头成交量的区域呈红色(分配);混合区域则介于两者之间。

如何解读:

  • 明亮、饱和的区域 = 高成交量集中度——这些是市场花费最多时间和成交量的价格水平。
  • 绿色调区域 = 该价格水平主要由多头压力构建——潜在的支撑/积累区。
  • 红色调区域 = 该价格水平主要由空头压力构建——潜在的阻力/分配区。
  • 金色 POC 线 跟踪成交量的平滑重心——当前真正的“公允价值”磁点,避免了原始控制点计算的跳动。
  • 白色趋势滤波 EMA 为你提供背景信息:当前热区是支持还是对抗主导趋势?
  • 实时 HUD 面板显示趋势状态以及价格距离 POC 的点数。

关键设置: 回溯窗口长度、价格区间数量(分辨率)、POC 平滑度、趋势滤波 EMA 周期,以及多头/空头混合色和 POC 线的全色彩自定义。

典型用例: 识别支撑/阻力区是由真实买卖压力构建而非仅仅成交量;将 POC 用作动态公允价值磁点;确认当前价格成交量是否与主导趋势一致或相悖;结合自身入场模型作为成交量背景过滤器。

最适合: 外汇主要货币对、黄金和指数的日内交易者,他们需要的不仅仅是平面成交量条或单色热图——可作为独立读取工具或与基于结构的交易设置结合使用的辅助工具。

摘要

AI 摘要
Impulse Heatmap is a directional volume heatmap indicator designed to analyze tick volume distribution across price zones with a focus on volume direction—buying versus selling—rather than just volume intensity. It segments volume into price bins similar to a volume profile but colors each bin based on the proportion of bullish-closing versus bearish-closing candle volume. Zones with predominantly bullish volume appear green, indicating accumulation or potential support, while zones with mostly bearish volume appear red, indicating distribution or potential resistance. Mixed zones show blended colors.

Key features include:
- Bright, saturated zones highlighting high volume concentration price levels.
- A gold Point of Control (POC) line representing a smoothed volume center of gravity as a dynamic fair value reference.
- A white trend filter EMA providing context on whether volume zones align with or oppose the prevailing trend.
- A live HUD panel displaying trend state and price distance from the POC in pips.
- Customizable settings for lookback window, price bin resolution, POC smoothing, trend filter EMA period, and color schemes.

Impulse Heatmap is suited for intraday traders focusing on forex majors, gold, and indices who require enhanced volume context to distinguish genuine buying or selling pressure at key support and resistance levels. It can be used standalone or combined with other structural or entry models.
指标配置
指标分类
趋势
输出类型
信号
可视化
数据要求
仅 K 线
跳动点数据
支持的信号
突破
反转
趋势强度
波动性
时段开盘区间
背离

客户评价

0.0
评价:0
客户评价
该产品尚无评价。已经试过了?抢先告诉其他人!

讨论

常见问答

EMA
Key Levels
AI-assisted
BOS
Volume
Market Structure
Support & Resistance
cTrader Store 提供的所有产品,包括交易机器人、指标和插件,均由第三方开发者提供,仅供信息参考和技术访问之用。cTrader Store 并非经纪商,不提供投资建议、个人推荐或任何未来业绩保证。

该作者的其他作品

指标
AI-assisted
Order Block
+5
The daily bias estimator indicator uses ICT concepts to show whether the chart is bullish or bearish on multi-time frame
指标
ATR
BOS
+5
Full ICT/SMC 4-step setup checker that alerts a long or short setup.
指标
Volume
Fibonacci
+5
Classic 9:30 Opening Range Breakout — auto-plots the range, flags volume-confirmed breakouts long or short, live.
指标
Flag
VWAP
+5
Session VWAP with statistical deviation bands, gradient cloud, and live rejection alerts — see exactly how stretched pri
指标
MSS
AI-assisted
+5
Live ICT Silver Bullet detection: liquidity sweeps, structure shifts, and killzone-gated FVGs, graded and glowing in rea
指标
ATR
Key Levels
+5
CPR indicator that actually predicts the day ahead: width percentile scoring for breakout-day detection
指标
Triangle
Double Top
+5
Know which liquidity sweeps are real. Auto-tracks EQH/EQL and confirms genuine reversals, not just broken levels.
指标
ATR
MSS
+5
Grades ICT Unicorn setups (Breaker Block + FVG confluence) into PRIME / SETUP / WATCH, with retest & RR targets.
指标
BOS
Volume
+5
20/40/60-day IPDA lookback ranges, Premium/Discount/Equilibrium zones, and quarterly shift alerts — anchored to true dai
指标
BOS
MSS
+5
One indicator, full ICT/SMC picture — structure, OBs, FVGs, liquidity, Premium/Discount — with graded PRIME/SETUP signal
指标
ATR
Volume
+5
Order blocks with measured hold-rate stats and confidence scoring — not just zones on a chart.
指标
BOS
CHOCH
+5
BOS/CHoCH signals confirmed by liquidity sweep + FVG confluence, with a live conviction score.

猜您喜欢

指标
SMC
Prop
+14
FVG Multi Time Frame Indicator
指标
Volume
Key Levels
+2
Support and resistance from a rolling volume profile, ranked by strength or recency, updated live.
指标
Forex
BTCUSD
+4
This indicator is designed to perform multiple non-linear regression analysis using four independent variables.
指标
ATR
Prop
+14
Optimize exits with Chandelier Exit! Visualize stop-loss points dynamically for improved trading precision and safety.
指标
Prop
VWAP
+5
VWAP is a powerful tool for intraday traders
指标
Breakout
Institutional Flow Radar scans the chart for abnormal volume events and classifies them into two groups: Capital &Public
指标
Shows BUY & SELL signals for 3 & 4 BAR PATTERN (Morning star/ Evening star). It is adjustable and it will SHOW ARROWS.
指标
AI
Grid
+9
Pivot Point MultiTimeFrame with Order Block
指标
SMC
Prop
+15
Previous HLOC – Smart Higher-Timeframe Levels for Precision Trading.
指标
Forex
cTrader ZigZag Alerts: Precision Swing Detection, Alerts, and Fibonacci.
指标
Auto Fibonacci Retracement Indicator for cTrader
指标
RSI
MACD
This indicator is a combination of MACD and RSI into one. This is perfect fusion and powerful indicator ever.
指标
BOS
CHOCH
+5
BOS/CHoCH signals confirmed by liquidity sweep + FVG confluence, with a live conviction score.
指标
Key Levels
Support & Resistance
Draws a colored High/Low/Open/Close box for any custom time range you set — trade breakouts & retests.
指标
Forex
BTCUSD
+11
Next-gen Volume Oscillator using Hyperbolic Tangent math. No repainting. Includes arrows, alerts, and overlay mode 🎯
指标
Prop
Forex
+14
Stochastic Momentum Index (SMI) for cTrader optional higher-timeframe source, and clear overbought/oversold levels.
指标
Indices
this indicator shows previous day high low and closed with precise manner.
指标
Engulfing
Fibonacci
+4
Six higher-timeframe candle sets on one chart, with liquidity sweep detection and swept levels.

价格

注册日期 07/05/2026
5
销售
63
免费安装




























