"Consolidation Zones" logo
Consolidation Zones
"Consolidation Zones" uploaded image
Since 25/09/2025
21
Sales
198
Free installs
About trial version
- 14 days trial - works on DEMO accounts only - Backtesting and Market replay always available Please leave your feedback, we are always improving our products!

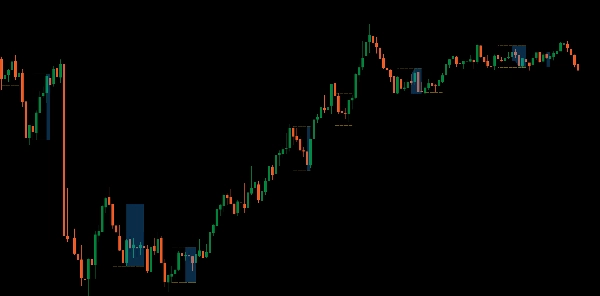
Introducing the Consolidation Zones indicator, designed to help you identify and capitalize on breakout opportunities with ease.

This powerful tool highlights zones on your chart where the price is consolidating, making it simple to spot potential breakout points. By visualizing these critical areas, you can better anticipate market movements and make more informed trading decisions.

Ideal for traders looking to enhance their strategy with clear and actionable insights, upgrade your trading toolkit and master breakouts with the Consolidation Zones indicator.

About trial version
- 14 days trial - works on DEMO accounts only - Backtesting and Market replay always available Please leave your feedback, we are always improving our products!
Indicator profile
0.0
Reviews: 0
Customer reviews
No reviews for this product yet. Already tried it? Be the first to tell others!
BTCUSD
Forex
Breakout
Indices
EURUSD
Commodities
GBPUSD
NZDUSD
Prop
Crypto
Stocks
XAUUSD
NAS100
USDJPY
Products available through cTrader Store, including trading bots, indicators and plugins, are provided by third-party developers and made available for informational and technical access purposes only. cTrader Store is not a broker and does not provide investment advice, personal recommendations or any guarantee of future performance.

More from this author

Professional execution engine for the Visual Risk Terminal. Instant batch orders, PnL syncing, and automated hedging.
1
Profit factor
0%
Max drawdown
Optimize exits with Chandelier Exit! Visualize stop-loss points dynamically for improved trading precision and safety.
Enhance trading with ATR Bands! Visualize market volatility using dynamic upper and lower ATR bands for precise decision
Enhance MACD Histogram! Visualize bull and bear price changes with vibrant colors for clearer, more insightful trading.
Customize the MACD! Choose colors, get real-time tick updates, and see crossover points for enhanced trading precision.
Unlock trading precision with QQE! Dual QQE indicators with a Bollinger Bands zero line provide clear buy/sell signals.
Customize your Moving Average! Choose any timeframe and price source for precision and flexibility in your analysis.
Visualize trends with Standard Deviation Channel! Display median, and add customizable upper/lower deviation channels.
"Stochastic RSI PRO" logo
5.0
(1)
$ 28
/
$40
Unlock Stochastic RSI PRO in cTrader! Overlay RSI, highlight zones, and identify divergences with customizable settings.
Visual risk management terminal for cTrader. Set Lot size, SL, and TP via chart lines with real-time PnL projections.
Enhance trading with TSI! Use the True Strength Index for clear insights into market momentum and trend strength.
Strict day trader using SMA/ADX filters. No grids—just disciplined risk management that resets for a clean slate daily.
1.4
Profit factor
25.93%
Max drawdown

You may also like

Lightweight utility indicator designed to preload and persist custom colors in cTrader’s “Recent Colors” list.
Professional Volume Profile Indicator - Shows volume distribution, POC, Value Areas & Buy/Sell pressure.
Bounty Killer is a cTrader indicator that automatically detects stop-hunt / liquidity-grab candles, highlighting where p
AI Quantum Trading Edge: Your Intelligent Trading Assistant
Risk Reward Management Tools(风险回报管理工具)
Wstęgi HTS 33 144 mobile
Premium Discount Levels - Professional Dealing Range Zones with Draggable Lines, Alerts, Wartermark & Backtest Mode.
SigmaTrend Oscillator is an advanced momentum-based trend identification tool that combines dynamic price
AI Quantum Trading Edge: Your Intelligent Trading Assistant
is a trend-following indicator designed to provide a clear view of market direction, momentum, and strength
Detects Head & Shoulders patterns, plots signals, and alerts for trading opportunities.
Super Trend Oscillator
INDICATOR,LIQUIDITY POOLS,ACCURATE SIGNAL, NO DELAY,80% PROBABILITY
Gann Pivot Vision is an innovative analytical tool that combines classic pivot reversal levels and Gann geometry
Stochastic RSI Indicator
Visualize global Forex trading sessions with clear time blocks for better timing and strategy planning.
VWAP Set to Tokyo Open
Bring the RMA to cTrader! This is the Relative Moving Average from TradingView.
Since 25/09/2025
21
Sales
198
Free installs