
Pivot Point Daily Indicator
Indicator
14 purchases
Version 2.0, May 2026
Windows, Mac
4.2
Reviews: 4
Description
Key Features:
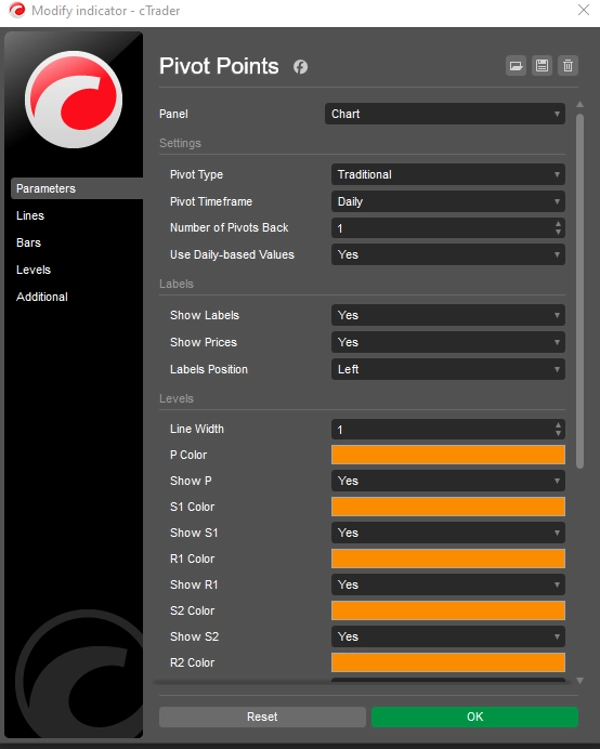
- Multiple Pivot Styles: Seamlessly switch between six pivot calculation methods: Classic, Fibonacci, Woodie, Camarilla, DM, and Traditional. Each method supports varying levels (up to R5/S5 for Traditional and Camarilla, R3/S3 for Fibonacci, and P/R1/S1 for DM).
- Flexible Timeframes: Choose from a wide range of pivot timeframes, including Auto, Daily, Weekly, Monthly, Quarterly, Yearly, and multi-year options (Biyearly, Triyearly, Quinquennially, Decennially). Perfect for aligning with your trading horizon.
- Historical Pivot Control: Set the number of historical pivot sets to display (1–200) with the Number of Pivots Back parameter, ensuring a clutter-free chart while preserving key historical levels.
- Customizable Appearance: Fully adjustable colors, line widths, and label settings. Toggle labels and price values on/off, and choose label positions (Left or Right) with smart vertical offsets for clarity.
- Daily or Intraday Data: Option to use daily-based values or chart timeframe data, providing flexibility for different trading strategies.
- Optimized Performance: Lightweight, native cTrader code ensures fast, real-time updates without lag, compatible with Forex, indices, commodities, crypto, and more.
Why Choose Pivot Points Standard?
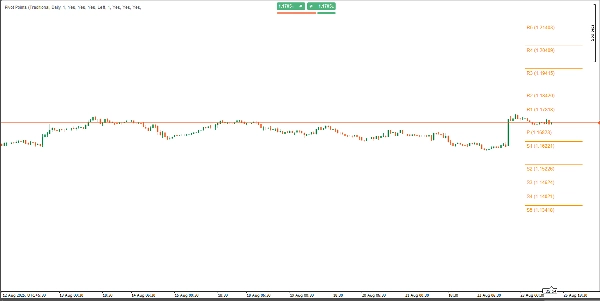
- Versatile Trading Tool: Identify key support/resistance levels, trend directions, and breakout opportunities across any market or timeframe.
- User-Friendly Interface: Intuitive dropdown menus for pivot type, timeframe, and label position make customization a breeze.
- Historical Analysis: Visualize up to 200 historical pivot sets to study past price interactions and refine your strategy.
- Clean Charting: Smart label positioning and customizable line lengths prevent chart clutter, enhancing readability.
How to Use:
- Apply the indicator to your cTrader chart.
- Select your preferred Pivot Type (e.g., Fibonacci, Camarilla) and Pivot Timeframe (e.g., Daily, Monthly).
- Adjust Number of Pivots Back to control historical sets displayed.
- Customize colors, line widths, and label settings to suit your style.
- Use pivot levels to identify support/resistance, set stop-loss/take-profit, or trade breakouts.
Ideal For:
- Day Traders: Leverage Daily or Weekly pivots for intraday entries and exits.
- Swing Traders: Use Monthly or Quarterly pivots to capture longer-term trends.
- Scalpers: Combine with lower timeframes for quick, precise trades.
- All Markets: Works seamlessly across Forex, stocks, crypto, and commodities.
Boost Your Trading Confidence
With Pivot Points Standard, you gain access to a powerful, all-in-one tool that simplifies technical analysis and enhances your ability to spot high-probability trading opportunities. Whether you’re a beginner or a seasoned trader, this indicator adapts to your strategy, providing clear, actionable levels to elevate your trading game.Try Pivot Points Standard today and take control of your trading with precision and clarity!One-time payment. Lifetime access. Future updates included.
Summary
AI summary
Pivot Point Daily Indicator is a multi-timeframe pivot point tool designed for the cTrader platform. It supports six pivot calculation methods—Classic, Fibonacci, Woodie, Camarilla, DM, and Traditional—each offering various resistance and support levels (up to R5/S5 for some methods). Users can select from a broad range of timeframes including Auto, Daily, Weekly, Monthly, Quarterly, Yearly, and multi-year intervals, allowing alignment with different trading horizons.
The indicator allows displaying up to 200 historical pivot sets to analyze past price interactions while maintaining chart clarity through customizable label positions and line settings. It offers options to use daily-based or intraday data, enhancing flexibility for diverse trading strategies.
Pivot Point Daily Indicator is optimized for real-time performance with native cTrader coding, compatible across Forex, indices, commodities, cryptocurrencies, and other markets. Its interface includes intuitive dropdown menus for pivot type, timeframe, and label customization.
Traders can use this indicator to identify key support and resistance levels, trend directions, and breakout opportunities, aiding in setting stop-loss and take-profit points. It suits various trading styles including day trading, swing trading, and scalping across multiple asset classes.
Indicator profile
Indicator category
Support & resistance
Output type
Filter
Data requirements
Bars only
Supported signals
Level break
Customer reviews
4.2
Reviews: 4
5 | 25 % | |
4 | 75 % | |
3 | 0 % | |
2 | 0 % | |
1 | 0 % |
Customer reviews
May 2, 2026
Bought it, added it, used it for a while, and now it's disappeared, and I cannot get it back!
August 28, 2025
Good helper for review if the trader wants it keeps attention on levels that actually matter. It works best as support, not a final decision maker. The cleanest use is 3 to 5 levels per chart, with 0.5 pullbacks checked before entry. not every zone holds, even if it looks clean.
August 27, 2025
August 27, 2025
Usable tool with purpose for traders who build plans around market levels. It gives value around key price zones, but not every zone holds, even if it looks clean. I would wait for 2 reactions and avoid trades where the target is less than 1.5R. Levels are useful when they reduce noise, not when they crowd the chart.
Discussion
FAQ
Fibonacci
Prop
Forex
Breakout
Indices
Commodities
Products available through cTrader Store, including trading bots, indicators and plugins, are provided by third-party developers and made available for informational and technical access purposes only. cTrader Store is not a broker and does not provide investment advice, personal recommendations or any guarantee of future performance.


!["[CB] Pivot Points Pro" logo](https://cdn.ctrader.com/image/webp/43463c82-67b0-4f10-a4ba-901bba091d81_32594)


Price
Since 30/05/2025
40
Sales