
Description
Pinescritlabs
Ctrader Store indicators: 🤖Pinescritlabs Ctrader Store cBots:
Fair Value Gap Sessions Gold & BTC Breakout Session Pivots(new)
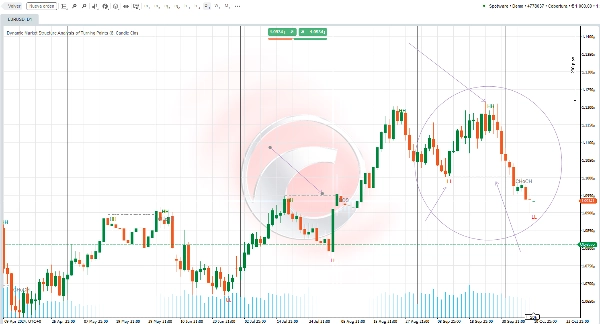
Dynamic Market Structure
Analysis of Turning Points
Fibonacci Linear
Regression Multi-timeframe
Multi-Level Candle Bias
Tracker
Auto Support and
Resistance Trend Lines
All Support and
Resistance Levels
Indicator Settings Overview 🌟
SWING LENGTH 📏
This parameter determines how many bars are considered to the left and right when searching for swing points. A lower value will show more points, while a higher value will reduce their quantity. It’s recommended to adjust this parameter based on your trading style and when switching between different timeframes.
CHOCH 🔄
Enabling this option will rename the first counter-trend breakout as CHoCH (Change of Character), thus indicating a possible shift in the market direction.
HH and LL 📈📉
The indicator will plot the swing high points (HH) and swing low points (LL) on the chart, allowing you to visualize the market structure more effectively.
BOS ⚡
The indicator will also display the Break of Structure (BOS) levels when detecting breakouts at swing points, providing additional insights into market dynamics.
Summary
Customer reviews
5 | 33 % | |
4 | 67 % | |
3 | 0 % | |
2 | 0 % | |
1 | 0 % |


