Indicator
Indices
Prop
Commodities
Stocks
Forex
Crypto
Smooth Heiken Ashi
"Smooth Heiken Ashi" logo
04/09/2025
2
Desktop
"Smooth Heiken Ashi" uploaded image


🟢 Smooth Heiken Ashi Indicator for cTrader

Trade with clarity. Ride the trend with confidence.

The Smooth Heiken Ashi indicator is a refined charting tool designed to filter out market noise and highlight true price momentum. Built for the cTrader platform, this indicator blends traditional Heiken Ashi candlesticks with a smoothing algorithm to deliver cleaner, more reliable trend signals.


šŸ” Key Features

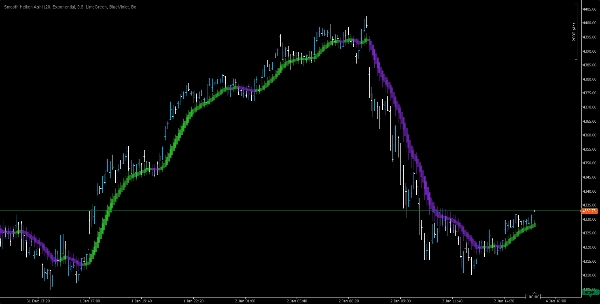
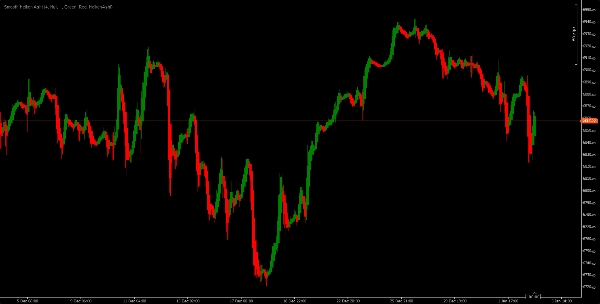
• Smoothed Heiken Ashi Candles

Reduce false signals and choppy price action with visually enhanced candles that emphasize trend direction.

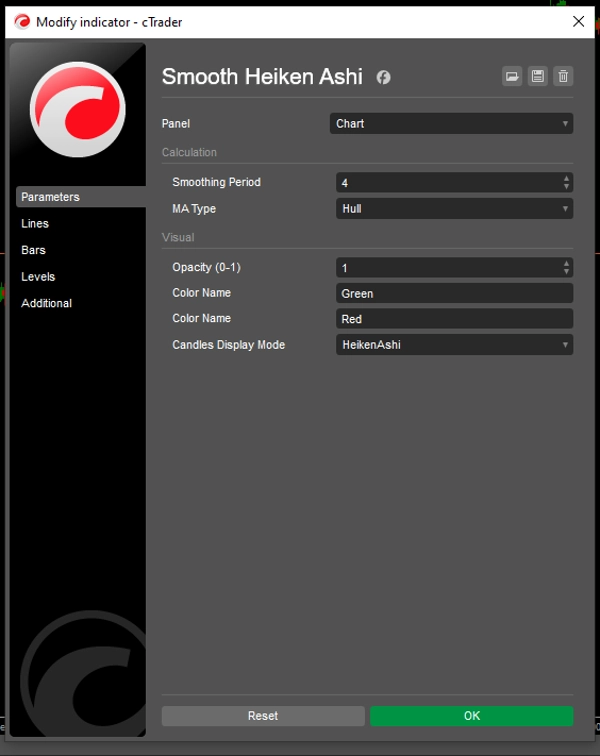
• Customizable Smoothing Options

Fine-tune the smoothing factor to match your trading style—whether you're scalping or swing trading.

• Trend Overlay Line

A dynamic curve overlays the candles to reinforce trend strength and potential reversals.

• Clean Visuals

Elegant color gradients and minimalistic design make your charts easier to read and interpret.


šŸ“ˆ Ideal For

• Trend-following strategies

• Momentum confirmation

• Filtering market noise

• Visual traders seeking clarity and precision


Smooth Heiken Ashi helps you stay focused on what matters—price direction, not distractions. Whether you're building an algorithmic system or trading manually, this indicator adds a layer of confidence to your analysis.


0.0
Reviews: 0
Customer reviews
No reviews for this product yet. Already tried it? Be the first to tell others!
More from this author
FVG
The Indicator is a powerful tool for price-action traders seeking to identify and exploit short-term imbalances.
Indicator
Indices
Prop
Stocks
+3
Fractals
Fractals is a precision-engineered trading indicator for cTrader that reveals the hidden architecture of price action.
Indicator
Grid
NAS100
XAUUSD
+6
AutoFibRetracement
A powerful overlay tool designed to automatically plot Fibonacci retracement levels based on a custom window.
cBot
NAS100
Indices
XAUUSD
+4
VolatilityScalper
A trading robot designed for traders who want precision for high-volatility markets (XAUUSD, US500, US100, WTI, others.)
Indicator
NAS100
Indices
XAUUSD
+4
PrevDayProjection
Automatically calculates the previous day’s high and low, determines the range, and then projects Fibonacci levels.
Indicator
Indices
Commodities
Stocks
+2
MARainbow
MARainbow gives you the edge with four customizable moving averages—each color-coded for instant recognition.
pATR
An indicator that redefines ATR by applying a percentile-based filter giving traders a grounded view of volatility.
Indicator
NAS100
Indices
XAUUSD
+6
JacksonZones
Maps intraday and multiday structure using Fibonacci-projected session ranges.
Indicator
Breakout
AI
Scalping
KaufmanEfficiencyRatio
A precision tool for measuring how efficiently price moves from point A to B.
DEnvelopSystem
DEnvelop is a high-performance trading indicator engineered for scalpers and intraday strategists who demand precision.
Indicator
NAS100
Indices
XAUUSD
+7
T3 Moving Average
A next‑generation moving average designed to deliver exceptional smoothness with minimal lag.
Indicator
Indices
Prop
Commodities
+3
OBScope
A cutting-edge indicator designed to detect and visualize high-probability zones based on swing highs, swing lows.
Indicator
Indices
Prop
Breakout
+3
RVI
A precision-crafted indicator that compares current volume to its historical average for the same time of day.
Indicator
Indices
XAUUSD
Breakout
+3
AnchoredVWAP
A precision overlay tool that combines session-aware VWAP logic and standard deviations.
Indicator
Indices
Breakout
Prop
+8
MarketRegimeAI
A cutting‑edge trading indicator that fuses AI and mathematics with adaptive logic to classify market regimes.
Indicator
NAS100
Indices
XAUUSD
+7
InstitutionalSignalOscillator
A precision-engineered indicator designed for traders who demand signal integrity across volatile markets.
You may also like
Volume Profile Triple Line - POC Median Mode
The Advanced Volume Profile Indicator calculates POC, Median, and Mode, revealing key price levels for smarter trading.
Indicator
Prop
Commodities
Stocks
+2
Light-Version BrickAlgo TrendPulse
šŸš€ Simplify Your Trading Decisions With Powerful Technical Analysis.
Indicator
XAUUSD
Breakout
Stocks
+6
Final Moving Average
Final Moving Average is an adaptive system designed to keep traders aligned with the true direction of the market
Indicator
RSI
Signal
MA-RSI HTF Confirmation
MA-RSI HTF Confirmation: Eliminate false signals and trade with confidence!
Zero Lag Exponential Moving Average
ZLEMA (Zero Lag EMA) is a faster, smoother version of EMA, ideal for capturing quick market shifts and trends.
Indicator
Breakout
BreakOut_Probability_Expo
Break Out Probability Experimental indicator. Credits for this indicator goes to Zeiierman !!!
Indicator
NAS100
NZDUSD
Breakout
+14
Matrix Pro by PrimeQuant
Multi-timeframe S/R, SRWMA trend & Demarker pivots with smart alerts—clarity for any market, any timeframe.
Risk Reward Guardian Scalping Swing Intraday Assistant
Trade fearlessly: auto-adjusts order blocks, manages risks, and ensures precision.
Indicator
Grid
NAS100
NZDUSD
+17
Institutional Volume Supply Demand
Volume Profile Supply Demand
Indicator
Indices
RSI
XAUUSD
+7
RSI Divergence
Detects bullish and bearish divergences
Renko 4k Pips
Custom your Renko Brick how do you wish!
Indicator
Breakout
Bollinger
Pressure Scanner
Pressure Scanner is a volatility-and-momentum to show both pressure states (squeeze on/off) and directional
Vishal Volume Profile v2.0
Volume Profile plots traded volume at each price level, highlighting high activity zones of precise support & resistance
Indicator
NAS100
NZDUSD
XAUUSD
+10
Candle Count
Label each candle sequentially with flexible session resets.
Indicator
NAS100
Indices
NZDUSD
+7
ICT Killzones & Macros
KILLZONES AND MACRO SESSIONS
SmartBot-MCDX Indicator
MCDX is a powerful and innovative indicator.
Indicator
Stocks
Forex
MACD
+1
SmartBot-Volume MACD
a revolutionary indicator that integrates volume into MACD.
Indicator
NAS100
NZDUSD
XAUUSD
+12
Footprint Chart_noSourceCode
"Footprint Chart: Visualize bid-ask volume inside candles for clearer order flow and market depth insights."