Indicator
Grid
NAS100
XAUUSD
Fibonacci
EURUSD
GBPUSD
BTCUSD
USDJPY
Scalping
AutoFibRetracement
"AutoFibRetracement" logo
30/09/2025
60
Desktop
Since 08/08/2025
Sales
4
Free installs
412
"AutoFibRetracement" uploaded image"AutoFibRetracement" uploaded image

📈 AutoFibRetracement Indicator

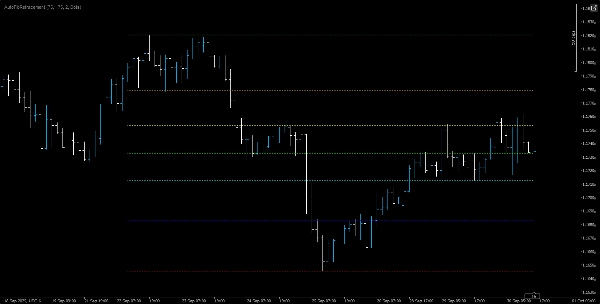
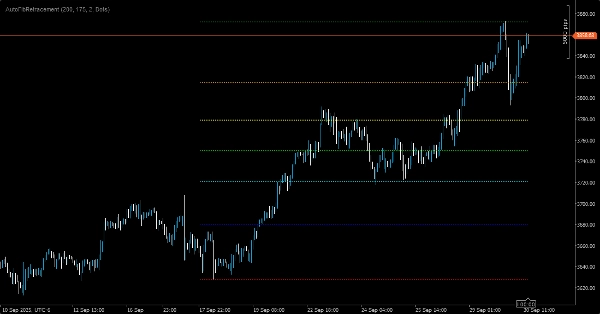
The AutoFibRetracement indicator is a powerful overlay tool designed to automatically plot Fibonacci retracement levels based on recent price swings. Ideal for traders seeking to identify potential support and resistance zones, this indicator dynamically calculates retracement levels using customizable parameters and displays them directly on the chart.

🔧 Key Features:

Automatic Swing Detection: Calculates swing highs and lows within a user-defined lookback window.

Customizable Period Window: Traders must select an appropriate window to accurately capture meaningful swing highs and lows. This choice is crucial for aligning retracement levels with actual market structure.

Fibonacci Levels: Includes standard ratios — 0%, 23.6%, 38.2%, 50%, 61.8%, 78.6%, and 100% — each color-coded for visual clarity.

Visual Styling Options:

Adjustable opacity (0–255) for line transparency.

Configurable line thickness and style (e.g., dotted, solid).

Overlay Display: Draws directly on the price chart for seamless integration with other technical analysis tools.

🎯 Use Case:

Perfect for swing traders, trend followers, and technical analysts who rely on Fibonacci retracement zones to plan entries, exits, and stop-loss levels. The effectiveness of this indicator depends on the trader’s ability to choose the correct window size — too short may miss broader swings, too long may dilute recent price action.

0.0
Reviews: 0
Customer reviews
No reviews for this product yet. Already tried it? Be the first to tell others!
More from this author
FVG
The Indicator is a powerful tool for price-action traders seeking to identify and exploit short-term imbalances.
Indicator
Indices
Prop
Stocks
+3
Smooth Heiken Ashi
The Smooth Heiken Ashi indicator is a refined charting tool designed to filter out market noise and highlight true price
pATR
An indicator that redefines ATR by applying a percentile-based filter giving traders a grounded view of volatility.
Indicator
Indices
Prop
Stocks
+3
Fractals
Fractals is a precision-engineered trading indicator for cTrader that reveals the hidden architecture of price action.
Indicator
NAS100
Indices
XAUUSD
+4
PrevDayProjection
Automatically calculates the previous day’s high and low, determines the range, and then projects Fibonacci levels.
Indicator
Indices
Breakout
Prop
+8
MarketRegimeAI
A cutting‑edge trading indicator that fuses AI and mathematics with adaptive logic to classify market regimes.
Indicator
Breakout
AI
Scalping
KaufmanEfficiencyRatio
A precision tool for measuring how efficiently price moves from point A to B.
Indicator
NAS100
Indices
XAUUSD
+7
InstitutionalSignalOscillator
A precision-engineered indicator designed for traders who demand signal integrity across volatile markets.
Indicator
Indices
Commodities
Stocks
+2
MARainbow
MARainbow gives you the edge with four customizable moving averages—each color-coded for instant recognition.
cBot
NAS100
Indices
XAUUSD
+4
VolatilityScalper
A trading robot designed for traders who want precision for high-volatility markets (XAUUSD, US500, US100, WTI, others.)
DEnvelopSystem
DEnvelop is a high-performance trading indicator engineered for scalpers and intraday strategists who demand precision.
Indicator
Indices
Prop
Commodities
+3
OBScope
A cutting-edge indicator designed to detect and visualize high-probability zones based on swing highs, swing lows.
cBot
XAUUSD
Breakout
ORB2
A high-performance cBot engineered to capture explosive moves in the gold market using the proven Opening Range Breakout
Indicator
Indices
Prop
Breakout
+3
RVI
A precision-crafted indicator that compares current volume to its historical average for the same time of day.
Indicator
Indices
XAUUSD
Breakout
+3
AnchoredVWAP
A precision overlay tool that combines session-aware VWAP logic and standard deviations.
You may also like
Indicator
XAUUSD
Breakout
Forex
+2
McDonalds Pattern-Bzier Curve
Designed to identify and visualize price reversal patterns using Bézier curves.
Indicator
Indices
CustomADX
Custom ADX Indicator for precise trend analysis. المؤشر المخصص ADX لتحليل الاتجاه بدقة
VegaXLR - RSI and StochRSI Alerts
VegaXLR's cTrader StochRSI identifies overbought/oversold RSI levels for precise trade entries.
BWMFI_Visual
BW_MFI Vizual colors bars
[Stellar Strategies] BOS Trend 1.0
[Stellar Strategies] BOS Trend: Premium multi-timeframe BOS indicator for precision trend analysis.📈📉
KAMA
Custom KAMA Indicator – Optimized for Speed and Precision
LaguerreRSI
Laguerre RSI: smoother, faster RSI with less noise. Great for spotting reversals and timing entries.
Indicator
Indices
Prop
Stocks
+3
ADX Indicator_noSourceCode
Identify Trend Strength with Absolute Precision on cTrader
Indicator
VWAP
Indices
Forex
TPO Profile v2.0
TPO Profile v2.0
Indicator
ATR
Forex
RISK V1
Automated position sizing based on risk, entry, and stop loss with ATR support and visual trade setup on charts.
Previous Day Liquidity Zones (PDH - PDL)
Useful indicator for traders who want to visualize key price levels based on previous daily highs and lows.
EMA UP&DOWN 2025
SectorIndex Dual Moving Average Indicator: Your Market Compass 🧭
Indicator
RSI
Indices
Signal
+2
[Stellar Strategies] Ultimate Trend & Momentum Dashboard
A comprehensive cTrader indicator designed to give you a quick, at-a-glance understanding of market sentiment 📈📉
CandleColourFlow_MultiFx
CandleColourFlow MultiFx - optimized to work on Fx Majors, Fx MInors, Fx Crosses
Indicator
NAS100
NZDUSD
Martingale
+22
Candle Timer
Candle Timer best used for Scalper
Renko Reversal
Renko Reversal catches powerful wick rejections on cTrader.
Top-rated
Free
FairValueGap
This Fair Value Gap (FVG) indicator is a technical analysis tool used to identify potential price imbalances.