
Description
Candlestick Signal Finder for cTrader
Turn Japanese candlesticks into a clear visual language.
Candlestick Signal Finder is an advanced indicator for cTrader that automatically detects the most popular Japanese candlestick patterns and highlights them directly on your chart using clear labels and colors.
No more scanning candles one by one: the indicator does the pattern recognition for you and shows where price is printing potential reversal or indecision signals.
Detected patterns
The indicator automatically identifies:
- BE – Bullish Engulfing → possible bullish reversal
- SE – Bearish Engulfing → possible bearish reversal
- H – Hammer → possible bounce/bullish reversal after a decline
- SS – Shooting Star → possible bearish reversal after a rally
- D – Doji → indecision, area to be cautious
- MS – Morning Star → strong bullish reversal potential
- ES – Evening Star → strong bearish reversal potential
- PL – Piercing Line → possible bullish reversal
- DC – Dark Cloud Cover → possible bearish reversal
- BH – Bullish Harami → possible bullish reversal
- SH – Bearish Harami → possible bearish reversal
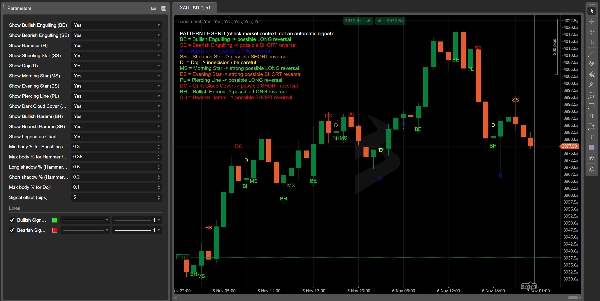
Each pattern is marked on the exact candle with a short code (BE, H, SS, etc.) and a color that matches the legend.
Color-coded on-chart legend
On the top-left corner of the chart you get a color-coded legend that matches the signals:
- same code
- same color
- short explanation of what it usually means (LONG / SHORT / caution)
This makes the indicator perfect for:
- traders who are learning candlestick patterns
- those who want a quick visual reminder without opening a book or website
- educators or content creators using charts for teaching and trade reviews
Fully customizable parameters
Candlestick Signal Finder gives you full control over detection sensitivity:
- Minimum body percentage for engulfing and strong candles
- Maximum body percentage for hammer, shooting star and harami
- Long/short shadow ratio for Hammer / Shooting Star type patterns
- Doji sensitivity (how small the body must be relative to the full range)
- Signal offset in pips to place labels above or below the candles
- Individual on/off switches for every single pattern
You can tune it for very strict signals (few but clean) or more permissive detection for visual backtesting and training.
Why traders like it
- Saves time: no more manually hunting for candlestick patterns.
- Reduces subjectivity: rules are numeric and repeatable, not based on eyeballing.
- Great for education: perfect to train your eye by scrolling through history and checking how patterns performed.
- Multi-timeframe & multi-symbol: works on indices, FX, crypto, stocks, commodities – anywhere you can attach an indicator in cTrader.
⚠️ Important: Candlestick Signal Finder is not a full trading system and does not replace a complete strategy. Patterns should always be used together with trend analysis, market context and proper risk management.
Summary
The indicator offers customizable detection sensitivity, allowing users to adjust parameters like minimum and maximum body size percentages, shadow ratios, Doji sensitivity, and label positioning. Individual patterns can be enabled or disabled to tailor the indicator to specific needs.
Candlestick Signal Finder supports multiple timeframes and symbols, including indices, forex, cryptocurrencies, stocks, and commodities. It is intended to assist traders in pattern recognition, reduce subjectivity through numeric rules, and serve as an educational tool for learning candlestick analysis. The indicator does not constitute a complete trading system and should be used alongside other analysis methods and risk management practices.
Customer reviews
5 | 100 % | |
4 | 0 % | |
3 | 0 % | |
2 | 0 % | |
1 | 0 % |


