
KaufmanEfficiencyRatio
Indicator
78 downloads
Version 1.0, Sep 2025
Windows, Mac
Description
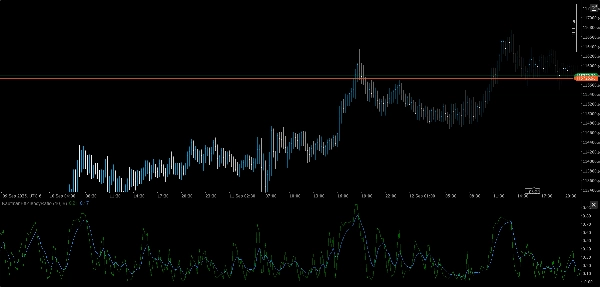
⚡ Kaufman Efficiency Ratio (KER)
Trend clarity, quantified.
The Kaufman Efficiency Ratio (KER) is a precision tool for measuring how efficiently price moves from point A to B—without getting lost in the noise. Whether you're validating breakout conditions or filtering sideways chop, KER gives you a clean score between 0 and 1 that reflects directional intent versus volatility.
🔍 What It Does
- Calculates Kaufman’s Efficiency Ratio:
- Outputs a normalized value from 0 (pure noise) to 1 (perfect trend)
- Highlights trending vs. non-trending regimes with zero ambiguity
- Ideal for adaptive overlays, regime filters, and signal gating
🛠️ Key Features
- Modular input manager for multi-timeframe sourcing
- Cross-asset compatible: FX, crypto, indices, equities
- Lightweight, real-time logic with no smoothing lag
- Plug-and-play with your existing suite architecture
🎯 Use Cases
- Trend Validation: Confirm directional bias before signal execution
- Noise Filtering: Suppress entries during inefficient price action
- Regime Detection: Pair with volatility-aware overlays for smarter transitions
- Strategy Building: Use as a core metric in breakout, momentum, or bias logic
💡 Bonus
KER is free, fast, and ruthlessly efficient—just like your code. No fluff, no filters. Just raw market intent, distilled.
Summary
AI summary
The Kaufman Efficiency Ratio (KER) is an indicator designed to measure the efficiency of price movement between two points by quantifying trend clarity. It calculates a normalized value ranging from 0 (indicating pure noise) to 1 (indicating a perfect trend), thereby distinguishing trending market conditions from sideways or choppy price action. KER is suitable for use across multiple asset classes including forex, cryptocurrencies, indices, and equities.
Key features include a modular input manager supporting multi-timeframe data, lightweight real-time calculation without smoothing lag, and compatibility with existing trading system architectures. The indicator is useful for validating trend direction before executing trades, filtering out noise to avoid inefficient entries, detecting market regimes when combined with volatility-aware overlays, and serving as a core metric in breakout, momentum, or bias-based strategies.
KER provides a clear, unambiguous score reflecting directional intent versus volatility, making it applicable for adaptive overlays, regime filters, and signal gating in trading strategies.
Indicator profile
Customer reviews
0.0
Reviews: 0
Customer reviews
No reviews for this product yet. Already tried it? Be the first to tell others!
Discussion
FAQ
Breakout
Scalping
AI
Products available through cTrader Store, including trading bots, indicators and plugins, are provided by third-party developers and made available for informational and technical access purposes only. cTrader Store is not a broker and does not provide investment advice, personal recommendations or any guarantee of future performance.


Price
25
Sales
2.11K
Free installs