
Description
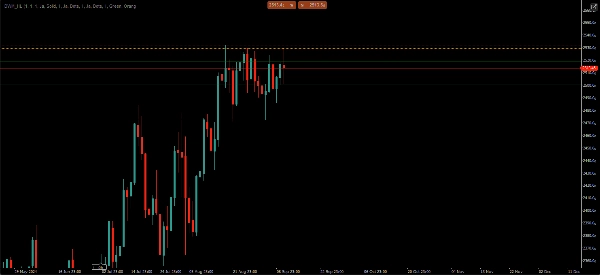
NGS Liquidity Levels – Daily • Weekly • Monthly Highs & Lows
Trade around liquidity, not around random lines.
NGS Liquidity Levels automatically displays the most important Daily, Weekly and Monthly liquidity levels on every chart.
• No manual drawing
• No timeframe switching
• No chart clutter
This user-friendly indicator helps traders identify key liquidity and market structure levels within seconds. Instead of manually marking highs and lows every day, the most important levels are automatically displayed and updated for you.
Features:
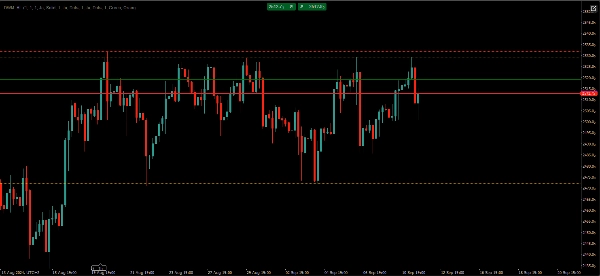
• Automatic Daily High & Low levels
• Automatic Weekly High & Low levels
• Automatic Monthly High & Low levels
• Optional previous period levels
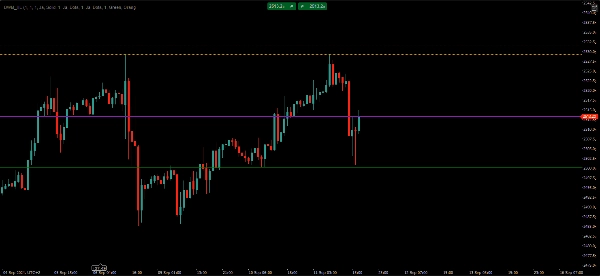
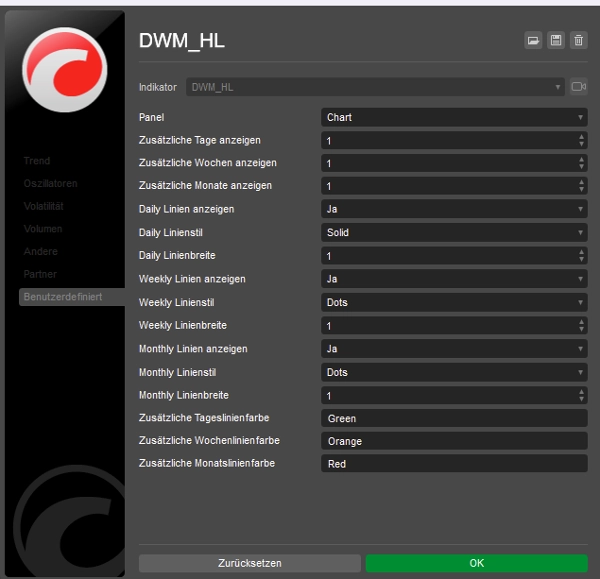
• Customizable colors and line styles
• Clean and lightweight chart display
• Works across Forex, Indices, Commodities and Crypto
• Supports multiple timeframes
• Non-repainting
Designed for traders who focus on market structure, liquidity and higher-timeframe levels.
No signals.
No strategy.
No profit promises.
Just objective liquidity levels and a cleaner trading workflow.
Summary
Customer reviews
5 | 100 % | |
4 | 0 % | |
3 | 0 % | |
2 | 0 % | |
1 | 0 % |


