pATR
Indicator
78 downloads
Version 1.1, Jan 2026
Windows, Mac
"pATR" uploaded image
14
Sales
1.54K
Free installs


šŸ“ˆ pATR – Percentile Average True Range

Precision Volatility. Smarter Risk. Institutional Edge.

The pATR indicator redefines traditional ATR by applying a percentile-based filter to recent true range values, giving traders a statistically grounded view of volatility. Instead of relying on simple averages, pATR calculates the nth percentile of recent price movement intensity — helping you identify breakout zones, fade setups, and risk thresholds with surgical accuracy.

Whether you're navigating prop firm challenges or refining your scalping strategy, pATR delivers a dynamic volatility benchmark that adapts to market conditions and keeps your risk calibrated.


šŸ” Key Features

• Percentile-Based ATR: Filters out noise and tail events for cleaner volatility signals

• Circular Buffer Logic: Optimized for speed and memory efficiency — no lag, no clutter

• Challenge Mode Ready: Ideal for prop firm traders managing drawdown and trade limits

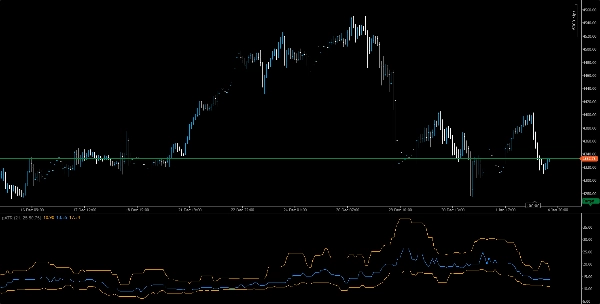
• Clean Visuals: Orange volatility line with intuitive scaling and overlay options

• Multi-Timeframe Compatible: Use across M1 to H1 for breakout, fade, or trend setups


🧠 Use Cases

• Breakout Confirmation: Use pATR spikes to validate momentum entries

• Risk Calibration: Align stop-loss and position sizing with percentile volatility

• Strategy Backtesting: Validate setups with consistent volatility thresholds


šŸŽÆ Who It's For

• Prop firm traders seeking rule-based risk control

• Scalpers and intraday strategists needing adaptive volatility filters

• Quantitative traders integrating percentile logic into custom systems

• Educators and mentors teaching volatility-aware execution

0.0
Reviews: 0
Customer reviews
No reviews for this product yet. Already tried it? Be the first to tell others!
Indices
Prop
Breakout
ATR
Commodities
Stocks
Forex
Signal
Crypto

More from this author

FVG
The Indicator is a powerful tool for price-action traders seeking to identify and exploit short-term imbalances.
Indicator
Indices
Prop
Stocks
+3
Smooth Heiken Ashi
The Smooth Heiken Ashi indicator is a refined charting tool designed to filter out market noise and highlight true price
Indicator
Grid
NAS100
XAUUSD
+6
AutoFibRetracement
A powerful overlay tool designed to automatically plot Fibonacci retracement levels based on a custom window.
Indicator
Indices
XAUUSD
Breakout
+3
AnchoredVWAP
A precision overlay tool that combines session-aware VWAP logic and standard deviations.
Indicator
NAS100
Indices
XAUUSD
+7
T3 Moving Average
A next‑generation moving average designed to deliver exceptional smoothness with minimal lag.
Indicator
Indices
Prop
Stocks
+3
Fractals
Fractals is a precision-engineered trading indicator for cTrader that reveals the hidden architecture of price action.
Indicator
NAS100
Indices
XAUUSD
+4
PrevDayProjection
Automatically calculates the previous day’s high and low, determines the range, and then projects Fibonacci levels.
Indicator
Indices
Commodities
Stocks
+2
MARainbow
MARainbow gives you the edge with four customizable moving averages—each color-coded for instant recognition.
Indicator
Breakout
AI
Scalping
KaufmanEfficiencyRatio
A precision tool for measuring how efficiently price moves from point A to B.
Indicator
Indices
Prop
Breakout
+3
RVI
A precision-crafted indicator that compares current volume to its historical average for the same time of day.
Indicator
NAS100
Indices
XAUUSD
+7
InstitutionalSignalOscillator
A precision-engineered indicator designed for traders who demand signal integrity across volatile markets.
cBot
NAS100
Indices
XAUUSD
+4
VolatilityScalper
A trading robot designed for traders who want precision for high-volatility markets (XAUUSD, US500, US100, WTI, others.)

You may also like

Time To Break Even Lite Version
This is the trial version of Time To Break Even, which help you time your trade entry.
Indicator
NAS100
NZDUSD
Breakout
+14
Precision FVG Analysis
Professional fair value gap detection with multi-timeframe insight, CE tracking, and clean institutional-grade visuals.
VegaXLR - Candlestick Patterns Pro
Identify 34 candlestick patterns, track trends across timeframes, and get instant alerts with this powerful trading tool
Indicator
Grid
NAS100
NZDUSD
+19
Trend Cycle
Trend Cycle – measure the life of your trends. See how long the current move has been running and how long similar trend
Indicator
Breakout
Round Number
Plots automatic psychological levels at round-number zones – major structure & liquidity levels.
VegaXLR - Candlestick Patterns Alerts
Real-Time Candlestick Pattern Detection with Custom Alerts & Trend Analysis for cTrader
VegaXLR - RSI and StochRSI Alerts
VegaXLR's cTrader StochRSI identifies overbought/oversold RSI levels for precise trade entries.
Indicator
Signal
[Stellar Strategies] Wave Trend Pro
Momentum oscillator identifying reversals using dual WaveTrend lines, histogram, and OB/OS levels with optional signals.
Indicator
NZDUSD
Forex
Signal
+6
Currency Meter KNN
Stationary Strength Meter, Machine Learning kNN Reversion Signals
Indicator
Indices
Breakout
Forex
+2
Time zone pro
FREE Global Trading Sessions Indicator
Range 10 Rsi
RSI Scalping cBot: quick‑fire trades on choppy symbols.
Indicator
Breakout
VegaXLR - Fixed Range Volume Profile
Identify key support and resistance levels through detailed volume distribution analysis.
14
Sales
1.54K
Free installs