Brokers & props
For business
00
Days
:
00
Hours
:
00
Minutes
:
00
Seconds
RSI + EMA Crossover Signals
Indicator
2 purchases
Version 1.0, Oct 2025
Windows, Mac
Since 16/03/2025
Traded volume
17.89M
Pips won
60.07K
Sales
104
Free installs
2470
"RSI + EMA Crossover Signals" uploaded image"RSI + EMA Crossover Signals" uploaded image

🎯 Overview
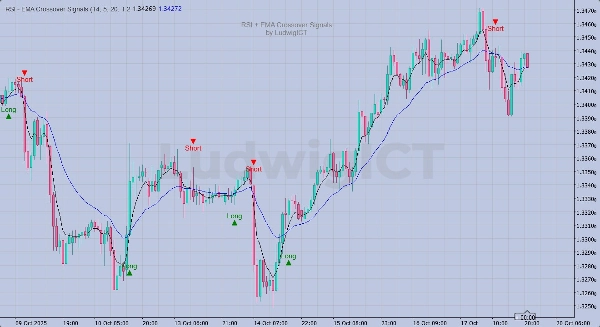
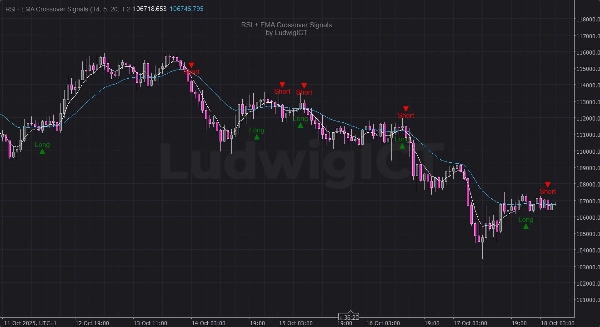
The RSI + EMA Crossover Signals indicator by LudwigICT combines momentum and trend confirmation to generate high-confidence Long/Short trading signals — directly on your chart.


⚙️ How It Works:

  1. RSI Signal Stage:
    • A signal is armed when the RSI crosses its own SMA signal line.
  2. EMA Confirmation Stage:
    • The signal is triggered only when fast and slow EMAs cross in the same direction.
  3. Signal Cancellation:
    • Any opposite crossover (RSI or EMA) cancels an untriggered signal.


✨ Key Features:

  • 🔁 Dual confirmation logic (RSI + EMA)
  • 📈 Clear Long and Short icons plotted directly on chart
  • ⚡ Dynamic ATR-based visual offsets (auto-adjusts to volatility)
  • 💧 Clean overlay with permanent watermark branding
  • 🧠 Smart “arming” and “cancellation” logic to reduce false triggers
  • 🧮 Fully adjustable RSI, EMA, and offset parameters


🔧 Inputs:

  • RSI Period (default: 14)
  • Fast EMA (default: 5)
  • Slow EMA (default: 20)
  • Signal Offset (ATR multiplier, default: 1.2)


📊 Ideal For:

  • Momentum traders
  • Trend confirmation systems
  • Manual or semi-automated trading strategies


📅 Version Updates:

  • ✅ Added ATR-based dynamic offset for clearer visuals
  • ✅ Improved signal accuracy logic
  • ✅ Added non-removable watermark for authenticity


© 2025 LudwigICT — All Rights Reserved.


If you have any questions or run into any issues, feel free to contact me. I'm happy to help You!

Disclaimer:

By using my algorithms, you acknowledge that trading involves inherent risks and that past performance does not guarantee future results. It is essential that you have a solid risk management strategy in place and, above all, that you remain disciplined in adhering to stop-loss levels. Failure to manage risk properly can lead to significant losses. I am not responsible for any financial outcomes resulting from the use of these algorithms. Trade responsibly and always follow proper risk management practices.

Bless up! 🙌

0.0
Reviews: 0
Customer reviews
No reviews for this product yet. Already tried it? Be the first to tell others!
NAS100
RSI
NZDUSD
Breakout
XAUUSD
Commodities
Forex
Signal
EURUSD
MACD
GBPUSD
BTCUSD
Indices
ATR
Stocks
Crypto
USDJPY
Scalping

More from this author

cBot
Indices
XAUUSD
Prop
+7
VALID Hi and Lo
ICT Valid High & Low Detector – Multi-Pair, Multi-Timeframe
Indicator
NAS100
NZDUSD
XAUUSD
+14
Elliott Wave Fib Auto
🚀 Automated Elliott Wave & Fibonacci tool for cTrader. Spot trends, corrections & retracements fast.
AlphaTrend Pro by LudwigICT
Indicator
NAS100
NZDUSD
Martingale
+26
Order Block detector PRO
Order Block PRO — Smart Institutional Zone Detector
cBot
XAUUSD
Commodities
Forex
+3
Volatility Sniper Breakout BETA
Volatility Sniper Breakout Bot (Beta) – Intelligent Breakout Trading for Volatile Markets
Indicator
NAS100
NZDUSD
Martingale
+26
Binary Options Signals Pro
Binary Options Signals Pro – Precision Trading at Your Fingertips
Indicator
Indices
XAUUSD
Prop
+8
FREE Squeeze Momentum from TradingView
Squeeze Momentum - Anticipate explosive market moves before they happen
Indicator
Grid
NAS100
RSI
+16
Smart Money Breakout Channels
Smart Money Breakout Channels – Auto-detect breakout zones with price, volume & volatility insights on cTrader.
Indicator
NAS100
NZDUSD
Martingale
+26
Silver Bullet by LudwigICT
Indicator
NAS100
NZDUSD
Breakout
+18
Volume Profile Pivot Box Range
Most advanced Volume Profile Pivot Box indicator — auto pivots, volume zones, smart candle coloring & SMC trading tool.
Indicator
XAUUSD
Forex
EURUSD
+2
ALMA Smoothed Gaussian Moving Average
ALMA Smoothed Gaussian Moving Average (ASGMA) – by LudwigICT
Indicator
NAS100
NZDUSD
XAUUSD
+14
Volume Profile Pivot Anchored
Anchor volume profiles to pivots with POC, VAH, VAL and real-time insights for clearer trade decisions.

You may also like

Indicator
RSI
Commodities
Signal
+1
Dot Momentum %BB Indicator
Dynamic circles visualize price's volatility position. Like RSI for market overextension & stretch. Quantify context.
Indicator
NAS100
NZDUSD
Martingale
+26
Kalman Filter Trend
Smarter trend detection with zero unnecessary lag.
Indicator
NAS100
NZDUSD
Breakout
+13
UNO MARKET SESSIONS
🌐 Uno Market Sessions (Optimize your trading window. See the market move in real-time with Uno Market Sessions).
Indicator
NAS100
NZDUSD
XAUUSD
+10
Tsunami Volume Surge - RVOL
🌊 See when the market is truly in play. Tsunami measures Relative Volume by time-of-day 🌊
Indicator
Breakout
Scalping
SMC
Bubble Indicator 2.0
Delta Peak Bubbles is a tick‑chart overlay for cTrader that highlights the strongest momentum spikes.
Indicator
NAS100
NZDUSD
Breakout
+15
Professional-grade Anchored VWAP
It calculates Anchored VWAP and StdDev bands from a user-defined start date for cTrader charts.
Indicator
Indices
Commodities
Stocks
+3
Advanced Ichimoku Kinko Hyo Pro
This indicator has an in built strategy analyzer that analyze the markets and generates quality signals.
Indicator
NAS100
NZDUSD
Martingale
+26
Dynamic Trend Flux
Dynamic Trend Flux is a colored momentum oscillator based on the classic fast/slow EMA difference plus a signal line.
Sharpe Ratio
Sharp Rate Indikator
period seperate
daily period separate indicator.
Indicator
NAS100
NZDUSD
Martingale
+26
The Market Temperature Moving Average
The "Market Temperature" Moving Average -Turn Your MA Into a Live Market Temperature Line
Indicator
Indices
Commodities
CCI - With Arrows and 40 80 EMA Logic_noSourceCode
The Advanced CCI & EMA Indicator combines the CCI with 40 & 80 EMA logic to generate precise arrows signaling direction