Brokers & props
For business
00
Days
:
00
Hours
:
00
Minutes
:
00
Seconds
Previous Day Liquidity Zones (PDH - PDL)
"Previous Day Liquidity Zones (PDH - PDL)" logo
Since 19/11/2024
Sales
15
Free installs
3198
"Previous Day Liquidity Zones (PDH - PDL)" uploaded image"Previous Day Liquidity Zones (PDH - PDL)" uploaded image"Previous Day Liquidity Zones (PDH - PDL)" uploaded image"Previous Day Liquidity Zones (PDH - PDL)" uploaded image"Previous Day Liquidity Zones (PDH - PDL)" uploaded image"Previous Day Liquidity Zones (PDH - PDL)" uploaded image

This tool allows users to specify a timeframe for analysis, such as daily, and plot high and low levels on their charts with customizable colors, styles, and thicknesses. It supports multiple previous days, making it easy to identify significant price action zones. The indicator also features optional labels for clarity, helping traders make informed decisions based on historical price data. Ideal for both novice and experienced traders, this tool enhances market analysis and trading strategies.

Features

Customizable Timeframe: Users can select a specific timeframe (e.g., daily) to analyze previous highs and lows, allowing for tailored visualization that fits their trading strategies.

Multiple Previous Days: The ability to plot high and low levels for multiple previous days provides a comprehensive view of significant price action zones.

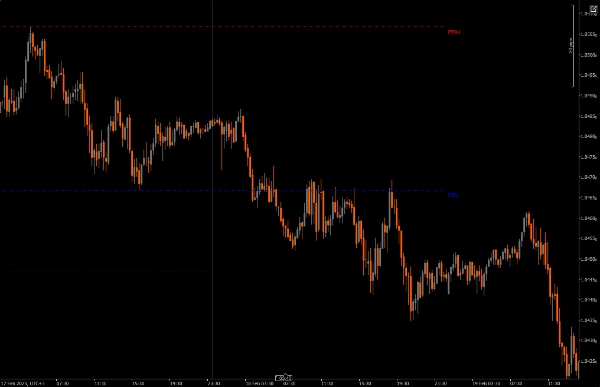
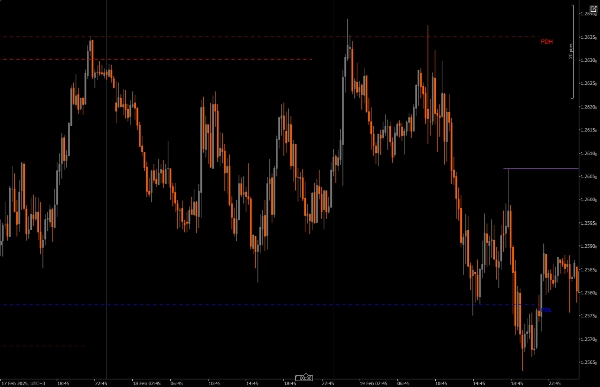
Dynamic Trendlines: The indicator draws trendlines for the previous day's high and low, making it easy to identify potential reversal zones at a glance.

Labeling Options: Users can enable labels to display the current high and low values directly on the chart, enhancing clarity and understanding.

Visual Customization: Traders can customize line colors, styles, and thicknesses to suit their preferences and improve chart readability.

Timeframe Restrictions: The indicator ensures that it operates only within specified minimum and maximum timeframe settings, reducing the amount of chart clutter while cycling through other timeframes.


Points to Note

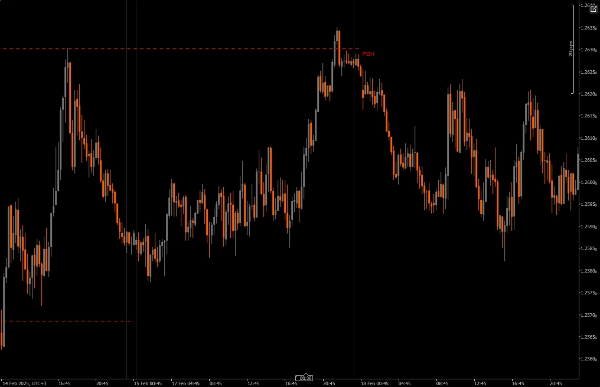
PDH or PDL in the market can be used as a draw on liquidity(DOL) or be used to frame a reversal.

Reversals can be framed off PDH and PDL when there is a failure to displace.

When price respects a PD array above or below, fails to displace over a Daily high or low level, the next candle can be anticipated.

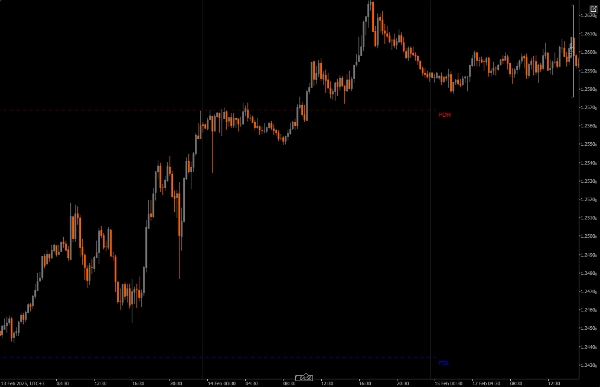
Is price more likely to reach for previous day high or low? When using PDH PDL as as a draw on liquidity(DOL)


Installation: Download and install the Daily Range Liquidity Zones (PDH PDL) on your cAlgo platform.

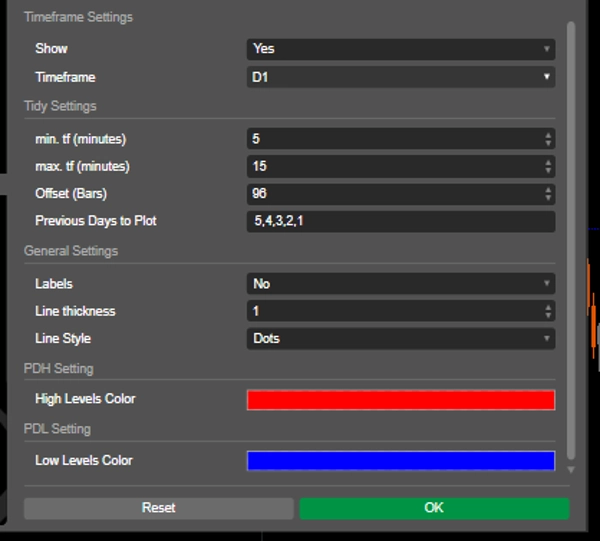
Setup: Open the indicator settings and select your desired timeframe for analysis, the number of previous days to plot, and customize visual parameters like line color and thickness.

Using the Indicator: The indicator will automatically plot the previous day’s high and low levels on your chart based on the specified settings.

Analyze: Observe the plotted levels as you trade. Use these levels to frame potential reversals, and make informed trading decisions.


Recommended Companion Tools

cTrader: The native platform for cAlgo, providing a seamless environment for using and customizing indicators.

Technical Analysis Tools: Combine this indicator with other tools like Fair Value Gaps(FVG) and Reversal Pattern Indicators(CRT) to enhance your trading strategy and market analysis.

Risk Management Tools: Utilize position size calculators and stop-loss tools to effectively manage risk while trading around the identified high and low levels.

By integrating the Daily Range Liquidity Zones (PDH PDL) with these tools, traders can enhance their market analysis and improve their chances of success in navigating the complexities of price action.

5.0
Reviews: 2
5
100 %
4
0 %
3
0 %
2
0 %
1
0 %
Customer reviews
August 12, 2025
Pros: Auto-draws previous day high/low, lightweight, customizable. Cons: No weekly/monthly levels, no alerts, limited zone options
May 30, 2025
Belíssimo trabalho! obrigada!
More from this author
ICT Killzone and Sessions high_low
This indicator is an essential tool for traders seeking to visualize key trading sessions on their charts.
Indicator
XAUUSD
Commodities
FVG_tidypips
A Fair Value Gap (FVG) indicator that identifies potential price imbalances, potential reversal and continuation zones
Moving Average channel
This indicator is designed to display customizable moving averages (MAs) on a chart.
Daily Open Pivot Level
This indicator is a valuable tool for traders looking to identify significant opening price level of any asset.
Drawing Utility
A rectangular box with 5 adjustable Fibonacci level or even custom ones.
Indicator
XAUUSD
Commodities
True Open Pivot Levels
This indicatorFull Description: Th shows the open price lines at key market times based on Eastern Standard Time (EST).
Previous Day Equilibrium (Premium & Discount)
Plots the equilibrium price levels based on previous daily highs and lows.
You may also like
ScalperSignalVisual
Overview of the Fade Breakout Visualizer Indicator
Indicator
Stocks
Commodities
Forex
buy sell
SmartSignal Pro: Precise BUY/SELL signals to profit in any market. Trade like a pro! 🚀
Momentum Trend Analyzer
Provides comprehensive trend and momentum analysis by combining EMAs, RoC, normalized ATR, RSI, and volume..
Indicator
NAS100
NZDUSD
Breakout
+18
Volume Profile Pivot Box Range
Most advanced Volume Profile Pivot Box indicator — auto pivots, volume zones, smart candle coloring & SMC trading tool.
Indicator
Indices
ATR
Forex
+1
[Stellar Strategies] Market Regime Filter
Filters market regimes (trend/range/pullback) using MAs, ADX, ATR/BBW Vol, opt. Volume. Helps adapt strategy. 📉📈
MM-Symbol Info (free)
Enhance the trading experience with real-time Spread, Time To Close, rPNL, uPNL, PNL and minimalistic Bid / Ask lines
Indicator
Breakout
ORB v1
Opening Range Breakout (ORB) - Visual Edition
IR VLine
don't move to the end of chart after timeframe changing. it should be better to use for near history. for long history
IR Candle MTF
with this indicator you could see other time frame candle in your chart.
IVB 2.0
IVB 2.0 is an indicator that works on the strategy of imbalance of the maximum volatility box of indices
Indicator
NAS100
NZDUSD
Martingale
+26
Dynamic Trend Flux
Dynamic Trend Flux is a colored momentum oscillator based on the classic fast/slow EMA difference plus a signal line.
Indicator
NAS100
NZDUSD
XAUUSD
+13
MACD Histogram PRO
Enhance MACD Histogram! Visualize bull and bear price changes with vibrant colors for clearer, more insightful trading.
Area of Interest
Area of Interest with the power of AI to detect the market interest.
Indicator
NAS100
NZDUSD
XAUUSD
+10
[Stellar Strategies] Smart ADX
Master trends with Smart ADX: MTF Scanner, precise Buy/Sell signals, Divergence & clear Exit targets 🎯
Indicator
Indices
XAUUSD
Forex
+3
Trend Following Trial2
TREND FALLOWING: Advanced technical indicator signal.
Parabolic RSI Alert  V1
Master RSI reversals with Parabolic SAR precision! Get real-time alerts for high-probability trend changes.
Indicator
Grid
NAS100
RSI
+18
QX SessionBox ORB
QX SessionBox ORB: Session boxes + ORB levels + clean dashboard with optional closed-candle breakout signals.
Indicator
Indices
Stocks
Forex
+2
HorizontalSupportResistance
This extraordinary multi-timeframe support and resistance indicator is nothing short of market wizardry.