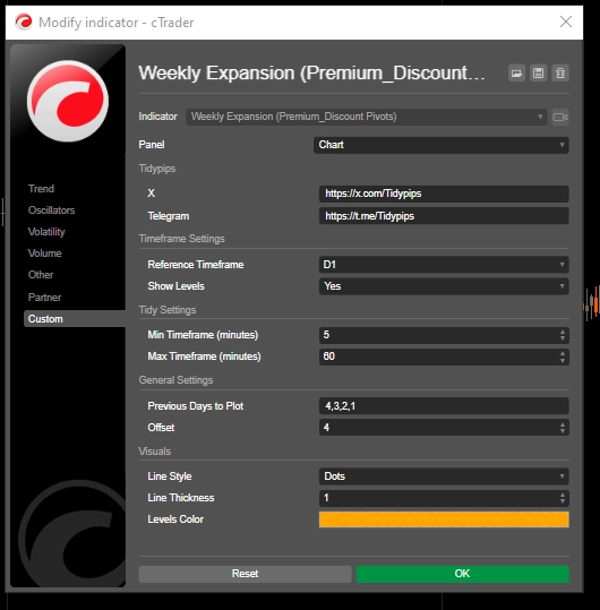
Brokers & props
For business
00
Days
:
00
Hours
:
00
Minutes
:
00
Seconds
Previous Day Equilibrium (Premium & Discount)
Indicator
Version 1.0, Aug 2025
Windows, Mac
Since 19/11/2024
Sales
15
Free installs
3706
"Previous Day Equilibrium (Premium & Discount)" uploaded image"Previous Day Equilibrium (Premium & Discount)" uploaded image"Previous Day Equilibrium (Premium & Discount)" uploaded image"Previous Day Equilibrium (Premium & Discount)" uploaded image"Previous Day Equilibrium (Premium & Discount)" uploaded image

Tired of spending forever marking your charts? This indicator does it for you super fast.

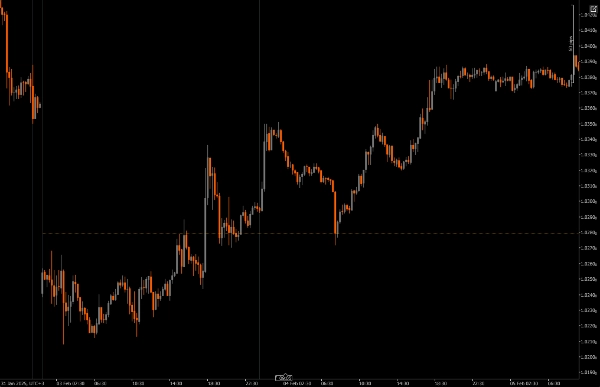
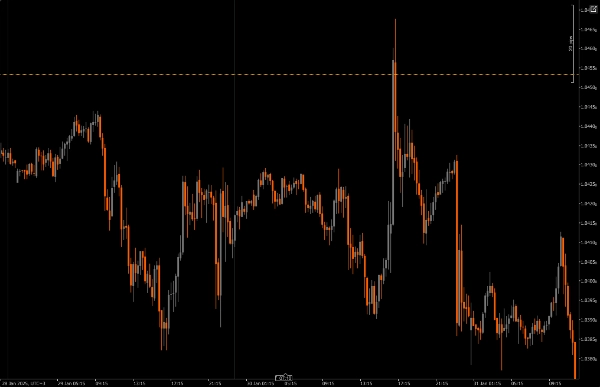
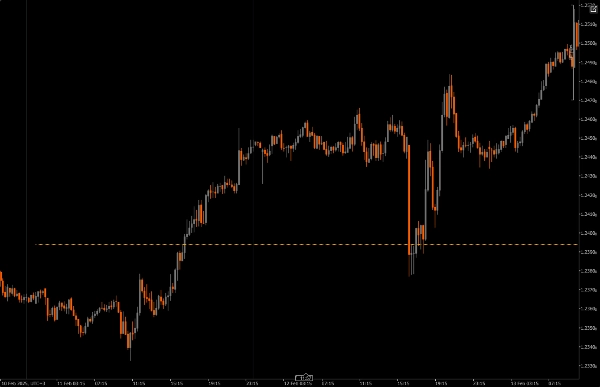
It finds the middle point between the previous day's high and low, and plots it on your charts. Now you can scan your charts super quick. Easy peasy!

Some Cool Features
Customizable Reference Timeframe: You can choose a min and max timeframe to plot significant price levels, which helps align your intraday trades with broader market trends.

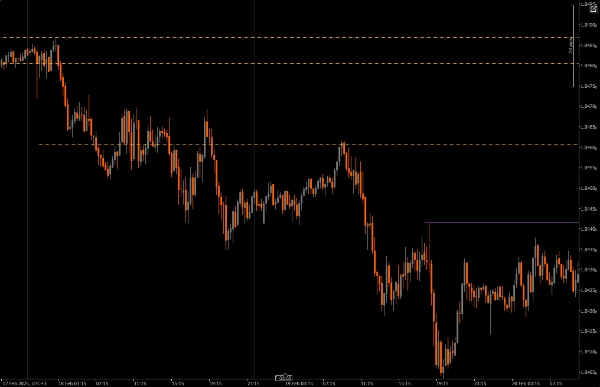
What make this indicator special is the ability to follow the weekly candle as it prints on a day to day basis making it easier to catch the expansion of the weekly candle.

Offset Parameter: This feature lets you decide how far into the future the plotted levels extend, giving you a clearer picture of potential future price continuation zones.

Visual Customization: You have plenty of options to tweak line styles, thickness, and colours, making it easy to create a chart that fits your personal style and is easy to read.

Timeframe Restrictions: The indicator includes checks to make sure it only works within your specified timeframe settings, so you can avoid chart clutter as you cycle through other timeframes.


Points to Note:

A personal favourite

Are you like me and cannot stay away from lipstick on your charts, then try this indicator. Has a timeframe restrictions and lookback period functionality aimed at reducing chart clutter.

This indicator is useful in following how the weekly candle develops; If the weekly expansion exhibits signs of a bullish order flow then the pivot levels on this indicator visualize areas or zone to join the bullish expansion similarly, If the weekly expansion exhibits a bearish order flow then the pivot levels on this indicator visualize areas or zone to join the bearish expansion


Installation: Start by downloading and installing the Previous Day Equilibrium, on your cAlgo platform.

Setup: Open the settings to pick your reference timeframe, choose how many previous days you want to plot, and customize the visual settings to your liking.

Analysis: As you trade, keep an eye on the plotted levels on your chart. These levels indicate where price might reverse from might be based on historical price action, helping you make more informed decisions.

Execution: Use these levels to determine your entry and exit points, as well as stop-loss and take-profit orders, integrating them into your overall trading strategy.


Recommended Companion Tools:

cTrader: This is the best platform for using the Previous Day Equilibrium, providing a smooth experience for customization and analysis.

Technical Analysis Tools: Pair this indicator with other tools like moving averages or oscillators to get a more complete view of market trends.

Risk Management Tools: Utilize calculators and stop-loss tools to help manage your risk effectively while trading around these key levels.

By using the the Previous Day Equilibrium, alongside these tools, you can enhance your trading strategy and increase your chances of success in the fast-paced world of intraday trading.

0.0
Reviews: 0
Customer reviews
No reviews for this product yet. Already tried it? Be the first to tell others!

More from this author

ICT Killzone and Sessions high_low
This indicator is an essential tool for traders seeking to visualize key trading sessions on their charts.
Indicator
XAUUSD
Commodities
FVG_tidypips
A Fair Value Gap (FVG) indicator that identifies potential price imbalances, potential reversal and continuation zones
Previous Day Liquidity Zones (PDH - PDL)
Useful indicator for traders who want to visualize key price levels based on previous daily highs and lows.
Daily Open Pivot Level
This indicator is a valuable tool for traders looking to identify significant opening price level of any asset.
Moving Average channel
This indicator is designed to display customizable moving averages (MAs) on a chart.
Indicator
XAUUSD
Commodities
True Open Pivot Levels
This indicatorFull Description: Th shows the open price lines at key market times based on Eastern Standard Time (EST).
Drawing Utility
A rectangular box with 5 adjustable Fibonacci level or even custom ones.

You may also like

Indicator
VWAP
ZigZag
RSI
+6
RSI T3 overbought and oversold area
Indicator
NAS100
NZDUSD
XAUUSD
+12
WT - Amplitude - Momentum Detection
Experience a new approach with amplitude-based momentum analysis. Smart Trend Detection That Adapts to Market Volatility
Indicator
VWAP
NAS100
Indices
+8
Vwap PRO
VWAP Pro – The Ultimate VWAP 💎💰
Indicator
NAS100
XAUUSD
FVG
+10
FVG with HTF Confluence
This is a specialized indicator that focuses exclusively on identifying Fair Value Gaps (FVGs) that are aligned with HTF
Indicator
NAS100
NZDUSD
XAUUSD
+12
Auto Chart Patterns
🎯Automatically detects and visualizes classical chart patterns using multi-timeframe swing point analysis.
Indicator
Scalping
Nadaraya-Watson Kernel Regression
Ultra-smooth adaptive trend line via Gaussian kernel regression — low lag, clean structure.
Indicator
NAS100
Indices
NZDUSD
+9
Smart SR Levels
Automate your price action analysis with stable, time-anchored Support & Resistance zones that adapt to breakouts in rea
Indicator
Indices
Prop
Stocks
+3
Bar Time
Bar Time Timeframe / Renko
Indicator
Indices
RSI
Signal
+2
[Stellar Strategies] Ultimate Trend & Momentum Dashboard
A comprehensive cTrader indicator designed to give you a quick, at-a-glance understanding of market sentiment 📈📉
Indicator
Indices
Prop
Stocks
+6
New Way Sar - Pro
The Parabolic SAR, or "Stop and Reverse," is a dynamic technical analysis tool.
Indicator
Indices
Signal
Whale Hunting For boom crash
The **Whale Hunting Indicator** is a trading tool for **Boom & Crash and Volatility indices**, featuring **Auto Trend De
Indicator
NAS100
NZDUSD
Breakout
+13
Pivot Breaker Block
Automatically identifies key price turning points (local highs and lows) and builds "price blocks" around these critical