
MTF Candle Window - On Chart
Indikator
7 käufe
Version 1.0, Feb 2025
Windows, Mac
4.3
Bewertungen: 3
Beschreibung
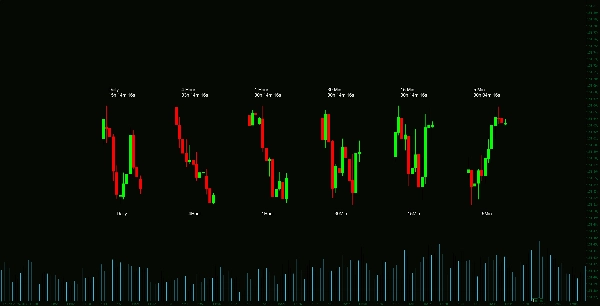
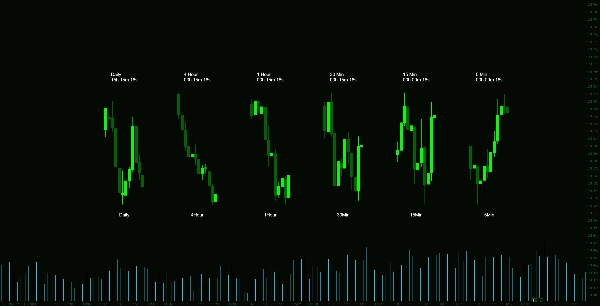
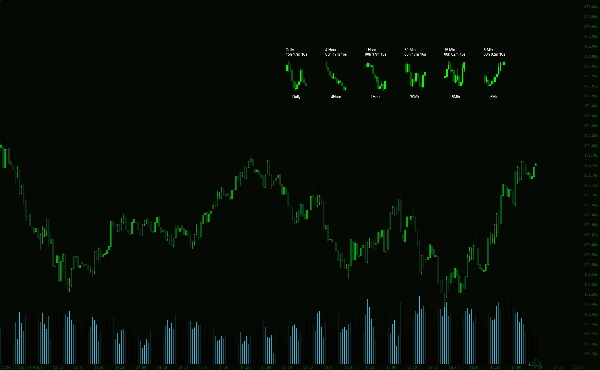
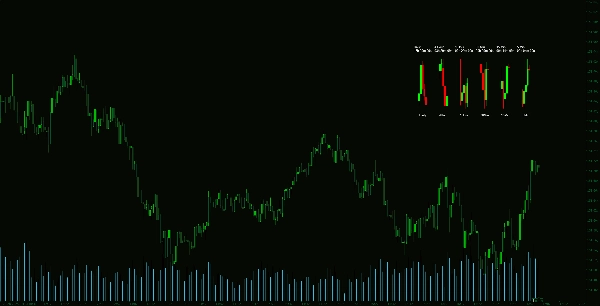
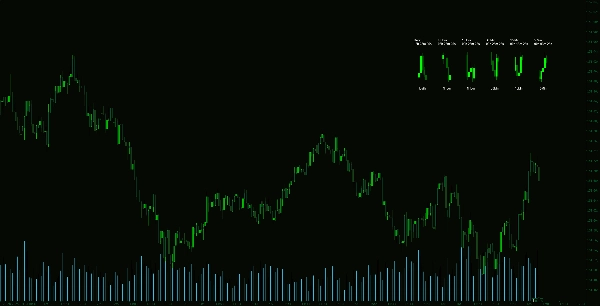
Der Multi-Timeframe Candle Indicator ist ein hochgradig anpassbares Werkzeug, das eine klare, kompakte Ansicht der Kursbewegungen über mehrere wichtige Zeitrahmen bietet. Er zeigt Kerzen aus mehreren Zeitrahmen in einem eigenen Fenster an, sodass Händler die Marktstruktur schnell beurteilen können, ohne die Charts wechseln zu müssen.
Hauptmerkmale:
Zusammenfassung
KI-Zusammenfassung
The Multi-Timeframe Candle Indicator is a customizable trading tool that displays price candles from multiple major timeframes within a single dedicated window on the chart. This allows traders to efficiently monitor market structure and price action across different timeframes without switching between charts. Key features include adjustable candle height, horizontal and vertical offsets, and the number of candles shown per timeframe. It also offers a dynamic countdown timer indicating the time remaining until each candle closes, positioned at the top or bottom of the candles. Users can fully customize the appearance by modifying colors, text offsets, and font sizes to suit their trading preferences. This indicator supports streamlined market analysis by helping traders quickly identify trends, reversals, and momentum shifts, enhancing decision-making and trade execution.
Indikatorprofil
Kundenbewertungen
4.3
Bewertungen: 3
5 | 33 % | |
4 | 67 % | |
3 | 0 % | |
2 | 0 % | |
1 | 0 % |
Kundenbewertungen
February 20, 2025
Entry aware signal check for chart reading. it makes market context easier to scan, especially when used for adding confirmation before a trade. I would test it on 2 timeframes, 20 signals and a 1R stop plan. It is stronger when a 1.5R target is realistic before the entry.
February 19, 2025
February 19, 2025
Setup first trade assistant for a more controlled workflow. It helps with adding confirmation before a trade, but it should not be used as a blind entry trigger. I would test it on 2 timeframes, 20 signals and a 1R stop plan. I would still keep manual review in the process.
Diskussion
Häufig gestellte Fragen (FAQ)
Über den cTrader Store verfügbare Produkte, einschließlich Handelsbots, Indikatoren und Plugins, werden von externen Entwicklern bereitgestellt und nur zu Informations- und technischen Zugriffszwecken verfügbar gemacht. cTrader Store ist kein Broker und erbringt keine Anlageberatung, persönlichen Empfehlungen oder eine Garantie für zukünftige Performance.


![„[Hamster-Coder] Moving Average MTF“-Logo](https://cdn.ctrader.com/image/webp/b11b98b1-194d-4b8e-b00e-d611826ad159_31226)

Preis
Seit 14/01/2025
55
Verkäufe
11.36K
Kostenlose Installationen