
Beschreibung
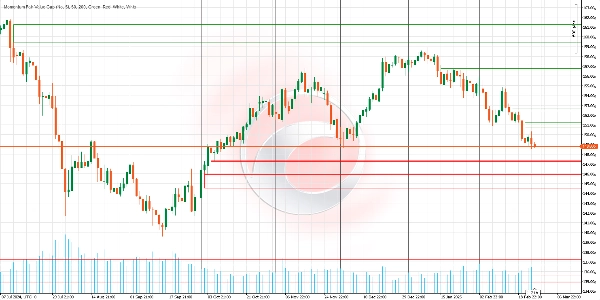
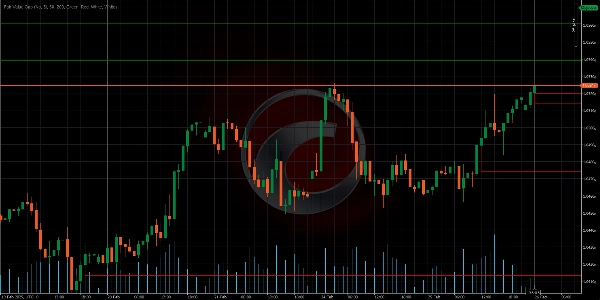
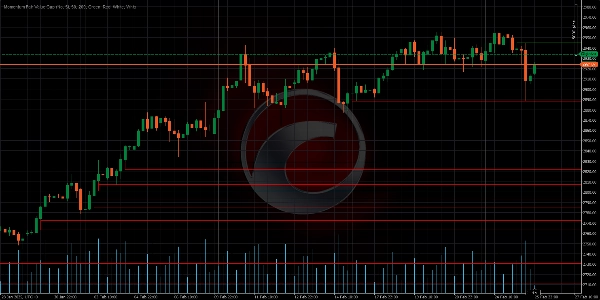
Es identifiziert Bereiche von Marktungleichgewichten (Fair Value Gaps oder FVGs) und projiziert sie auf intelligente Weise im Chart. Im Gegensatz zu anderen Indikatoren passt sich dieser in Echtzeit an die Kursbewegung an, indem er Größe, Beständigkeit und Relevanz anpasst. Er ist ideal für Trader, die klare Ziele und fortgeschrittenes visuelles Gap-Management suchen.
✨ HAUPTMERKMALE
- Dynamische Gap-Anpassung
Logik: Wenn der Preis ein FVG teilweise berührt (z. B. die untere Grenze streift), passt der Indikator die Größe des Gaps automatisch an, sodass nur der unbedeckte Bereich angezeigt wird.
Vorteil: Vermeidet falsche Signale und hält nur Gaps mit echtem Potenzial aktiv. - MidPoint-Füllung
Logik: Zeichnet eine Linie in der Mitte des Gaps. Wenn der Preis diese berührt, gilt das FVG als „gefüllt“ und kann entfernt werden (konfigurierbar).
Vorteil: Erfordert nur 50 % Kontakt zur Bestätigung des Verschlusses, wodurch Rauschen und vorzeitige Trades gefiltert werden. - Unendliche Projektion bis zur Füllung
Logik: Gaps erstrecken sich unbegrenzt in die Zukunft (sie verschwinden nicht nach X Kerzen).
Vorteil: Bietet eine dauerhafte Referenz, bis das Marktungleichgewicht aufgelöst wird. - Automatische Bereinigung ungültiger Gaps
Logik: Entfernt automatisch alte Gaps, wenn sie vollständig gefüllt sind.
Vorteil: Hält das Chart sauber und konzentriert sich auf aktive Zonen. - Fortgeschrittene visuelle Anpassung
Optionen: Verschiedene Farben für bullishe (grün) und bearishe (rot) Gaps. Transparenzanpassung zur Vermeidung von Chartüberladung.
Vorteil: Passt sich jedem Handelsstil oder visuellen Konzept an.
🎯 WIE IM HANDEL ANWENDEN?
Identifikation von Schlüsselzonen:
- Bullishes FVG (Grün): Bereich, in dem Käufer vorübergehend an Stärke verloren haben.
→ Strategie: Suche nach Kaufgelegenheiten bei Rücksetzern in diese Zone. - Bearishes FVG (Rot): Bereich, in dem Verkäufer übertroffen wurden.
→ Strategie: Suche nach Verkaufsgelegenheiten bei Anstiegen in diese Zone.
Interaktion mit dem Preis:
- Wenn sich das Gap dynamisch anpasst (seine Größe reduziert), zeigt dies, dass der Markt die Zone testet, aber ohne Bestätigung.
- Wenn das Gap entfernt wird (durch vollständige Füllung oder MidPoint), gilt das Ungleichgewicht als korrigiert.
🔍 BESTÄTIGUNG MIT ANDEREN WERKZEUGEN
Kombiniere FVGs mit Unterstützungen/Widerständen, Volumen oder RSI, um Signale zu filtern.
📋 FUNKTIONSVERGLEICH
___________________________________________________________________________________
Funktion Momentum Fair Value Gap Traditional Indicators
________________________________________________________________________________
Beständigkeit---------------- Erstreckt Gaps bis zur Füllung ----------------------- Verschwinden nach X Kerzen
Schließgenauigkeit-------- 50 % Bestätigungsoption --------------------- Erfordert vollständige Gap-Füllung
Flexibilität ------------------ Passt Größe an den Preis an ------------------------- Statische und unveränderliche Levels
Visueller Fokus---------------- Entfernt irrelevante Gaps ----------------------- Überfrachtet Chart mit historischen Daten
📝 PRAKTISCHES BEISPIEL
Szenario in EURUSD (1H):
Ein bullishes FVG (grün) bildet sich nach einer ausgeprägten bearishen Kerze. Tage später korrigiert der Preis und berührt die untere Grenze des Gaps, füllt es jedoch nicht. Der Indikator reduziert automatisch die Gap-Größe. Schließlich berührt der Preis den MidPoint (Mittellinie), was dessen Entfernung auslöst. Der Trader geht nach Bestätigung der Ablehnung in der Zone short.
Ctrader Store Indikatoren:
Dynamic Market Structure
Analyse von Wendepunkten
Fibonacci Linear
Regression Multi-Timeframe
Multi-Level Candle Bias
Tracker
Auto Support and
Resistance Trend Lines
Zusammenfassung
Key features include:
- Dynamic Gap Adjustment: Automatically resizes gaps when price partially touches them, reducing false signals.
- MidPoint Fill: Marks the gap centerline; if price touches it, the gap is considered filled and can be removed, requiring only 50% contact for confirmation.
- Infinite Projection: Gaps extend indefinitely until filled, maintaining persistent market imbalance references.
- Automatic Cleanup: Removes fully filled gaps to keep charts focused on active zones.
- Advanced Visual Customization: Uses distinct colors for bullish (green) and bearish (red) gaps with adjustable transparency.
In trading, bullish FVGs indicate zones where buyers lost strength, suggesting buying opportunities on pullbacks; bearish FVGs mark where sellers were overtaken, indicating selling opportunities on rallies. The indicator’s dynamic interaction with price helps confirm market imbalance resolution.
It is recommended to combine this indicator with other tools like support/resistance levels, volume, or RSI for signal filtering.
Kundenbewertungen
5 | 0 % | |
4 | 100 % | |
3 | 0 % | |
2 | 0 % | |
1 | 0 % |


