
Beschreibung
Pinescriptlabs Store Indikatoren: Pinescriptlabs Store cBots : (cBot) Gold & BTC BreakoutSession Pivots(neu)
PRICE ACTION (Neu)
Vorhersage basierend auf Linreg & ATR
SmartTrend Unterstützung &
Widerstand
Linien
Dynamische
Marktstruktur
Analyse
von
Wendepunkten
Punkten
Fibonacci
Lineare
Regression
Multi-Timeframe
Multi-Level
Kerzen-Bias
Tracker
Reaktive Gleitender Durchschnitt
Auto
Unterstützung und
Widerstand
Trend
Linien
Alle
Unterstützungs- und
Widerstandsniveaus
Levels
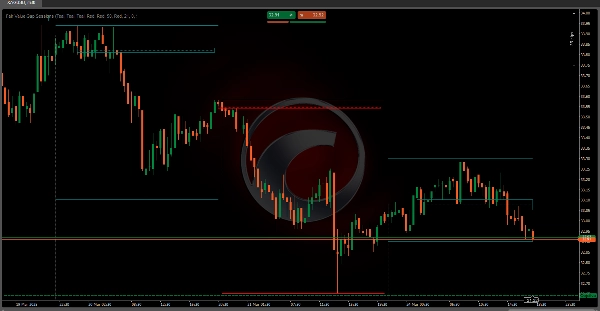
Fair Value Gap Sessions 📊💰
Der Fair Value Gap (FVG) Indikator ist ein ausgeklügeltes Trading-Tool, das entwickelt wurde, um vorübergehende Marktineffizienzen, bekannt als „Fair Value Gaps“ 🚨, innerhalb bestimmter Handelssitzungen zu identifizieren und hervorzuheben. Diese Lücken repräsentieren Momente, in denen sich der Marktpreis schnell bewegt ⚡ und ein Ungleichgewicht zwischen Käufern und Verkäufern entsteht.
Wichtige technische Mechanismen 🔧
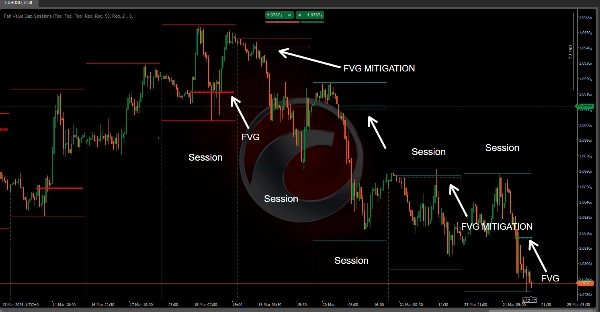
Sitzungsbasierte Architektur 🕒
• Implementiert einen präzisen, konfigurierbaren, sitzungsbasierten Analyseansatz
• Ermöglicht Händlern, benutzerdefinierte Sitzungsstartzeiten mit UTC- oder lokaler Zeitzonenunterstützung festzulegen 🌍
• Erstellt eine dynamische Sitzungsgrenze, die das Marktverhalten zurücksetzt und verfolgt 🔄
Fair Value Gap Erkennungslogik 🔎
• Nutzt fortgeschrittene Preisaktionsanalyse über mehrere aufeinanderfolgende Preisbalken
• Identifiziert Lücken durch Vergleich von:
o Aufeinanderfolgenden Balken-Hoch- und Tiefpreisen 📈📉
o Schlusskurs des vorherigen Balkens ✅
o Preisstruktur des aktuellen Balkens 🔄
Lückenklassifizierung 🏷️
Der Indikator unterscheidet zwischen zwei Haupttypen von Lücken:
- Bullish Fair Value Gap 📈
o Tritt auf, wenn der Preis über das vorherige Hoch springt 🔺
o Deutet auf potenzielles Aufwärtsmomentum im Markt hin 🚀
o Signalisiert möglichen Kaufdruck 💸 - Bearish Fair Value Gap 📉
o Tritt auf, wenn der Preis unter das vorherige Tief fällt 🔻
o Deutet auf potenzielles Abwärtsmomentum im Markt hin ⬇️
o Signalisiert möglichen Verkaufsdruck 🛑
Handelsanwendungen 📱💼
Strategische Einblicke 💡
• Hilft Händlern, Marktineffizienzen zu visualisieren 🖼️
• Bietet frühzeitige Warnung vor möglichen Trendwenden ⚠️
• Bietet präzise Identifikation von Ein- und Ausstiegspunkten 🎯
Risikomanagement-Funktionen 🛡️
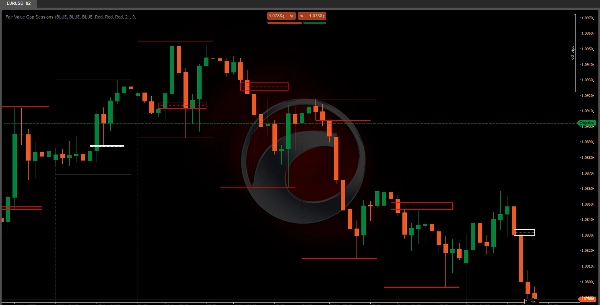
• Farblich codierte Visualisierung der Lückenstatus 🎨
• Verfolgt die „Minderung“ der Lücke (wenn der Preis in die Lückenzone zurückkehrt) ↔️
• Ermöglicht anpassbare Farbeinstellungen für verschiedene Marktbedingungen 🎨
Technische Visualisierung 🎨
Der Indikator erstellt zwei primäre visuelle Elemente:
- Lückenbereich-Rechteck 🟩
o Repräsentiert den Preisbereich der identifizierten Lücke 📐
o Erstreckt sich dynamisch über die Handelssitzung ➡️
o Ändert die Farbe basierend auf dem Lückenstatus (aktiv/mindert) 🟩➡️🟨 - Niveaulinie 📏
o Positioniert in der Mitte der Lücke ⚫
o Hilft Händlern, die zentrale Preiszone der Lücke schnell zu identifizieren 📍
o Verwendet verschiedene Linienarten zur Anzeige des Lückenstatus ➔
Praktische Handelsstrategien 📝
Einstiegssignal-Strategien 🚦
• Verwenden Sie die Lückenerkennung als potenzielles Trendfortsetzungssignal 🔄
• Achten Sie auf die Rückkehr des Preises zur (Minderung der) Lücke als Bestätigung ✅
• Kombinieren Sie mit anderen technischen Indikatoren für robuste Entscheidungsfindung 🤝
Risikomanagement-Techniken 🛡️
• Setzen Sie Stop-Loss nahe den Lückengrenzen ⛔
• Verwenden Sie die Lückenmitte als potenzielles Unterstützungs-/Widerstandsniveau 🪜
• Überwachen Sie die Lückenminderung als potenziellen Trendwendemarker ↔️⚠️
Konfigurationsflexibilität ⚙️
• Anpassbare Sitzungsstartzeit ⏰
• Zeitzonenkonfiguration (UTC/Lokal) 🌍
Durch das Verständnis und die korrekte Implementierung des Fair Value Gap Sessions Indikators können Händler tiefere Einblicke in Marktdynamiken gewinnen, potenzielle Handelsmöglichkeiten identifizieren und fundiertere Entscheidungen basierend auf Preisaktionsineffizienzen treffen. 🧠📈
Zusammenfassung
It classifies gaps into two types: bullish gaps, indicating potential upward momentum and buying pressure, and bearish gaps, signaling possible downward momentum and selling pressure. Visually, it represents gaps with dynamic rectangles showing the price range and a midpoint level line to help traders quickly locate the gap's central price zone. Colors and line styles change to reflect the gap's active or mitigated status.
Traders can use this tool to visualize market inefficiencies, receive early warnings of trend reversals, and identify precise entry and exit points. Risk management features include color-coded gap states, tracking of gap mitigation when price returns to the gap zone, and customizable color settings. The indicator supports practical strategies such as using gap detection for trend continuation signals and combining it with other indicators for decision-making. Stop-loss placement near gap boundaries and monitoring gap mitigation for trend reversal are also supported.
Kundenbewertungen
5 | 100 % | |
4 | 0 % | |
3 | 0 % | |
2 | 0 % | |
1 | 0 % |


