Beschreibung
Pinescriptlabs Store Indikatoren: Pinescriptlabs Store cBots : (cBot) Gold & BTC BreakoutSession Pivots(neu)
Vorhersage basierend auf Linreg & ATR
SmartTrend Unterstützung &
Widerstand
Linien
Dynamische
Marktstruktur
Analyse
von
Wendepunkten
Punkten
Fibonacci
Lineare
Regression
Multi-Zeitrahmen
Mehrstufiger
Kerzen-Bias
Tracker
Reaktive gleitende Durchschnitt
Auto
Unterstützung und
Widerstand
Trend
Linien
Alle
Unterstützungs- und
Widerstandsniveaus
Levels
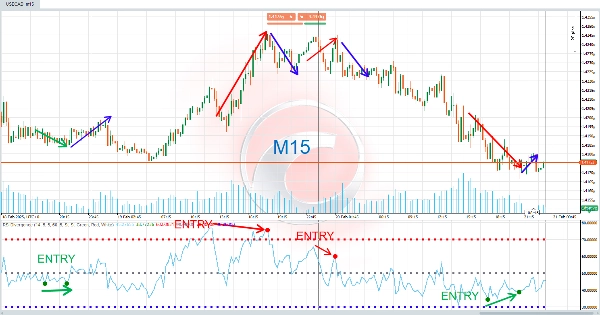
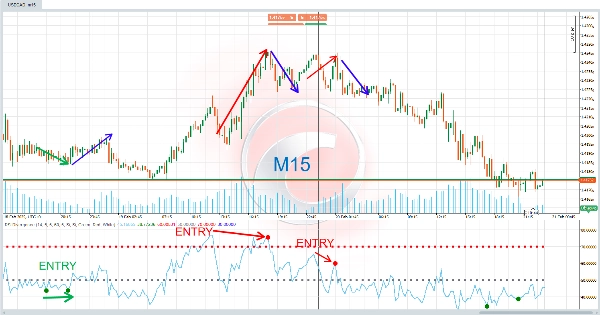
Der RSI Divergenz ist ein fortschrittliches Werkzeug der technischen Analyse, das entwickelt wurde, um Divergenzen zwischen dem Preis und dem Relative Strength Index (RSI) zu erkennen. Diese Divergenzen sind starke Signale, die Richtungsänderungen am Markt vorwegnehmen können, was es zu einer unschätzbaren Ressource für technische Trader macht. 🔍💡
⚙️ Wie funktioniert es?
Dieser Indikator basiert auf dem Prinzip, dass Preis und RSI nicht immer synchron verlaufen. Wenn eine Divergenz auftritt, bedeutet dies, dass der Preis ein Signal sendet, das dem zugrunde liegenden RSI-Trend widerspricht. Dies kann eine frühe Warnung sein, dass der aktuelle Trend an Stärke verliert.
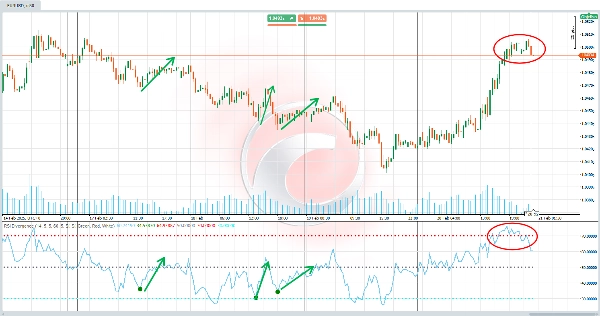
- Bullische Divergenz (Aufwärtstrend) 📈 :
Tritt auf, wenn der Preis tiefere Tiefs bildet , aber der RSI höhere Tiefs bildet . Dies deutet darauf hin, dass obwohl der Preis fällt, die Aufwärtsdynamik an Boden gewinnen könnte, was möglicherweise zu einer Aufwärtswende führt. ✅ - Bärische Divergenz (Abwärtstrend) 📉 :
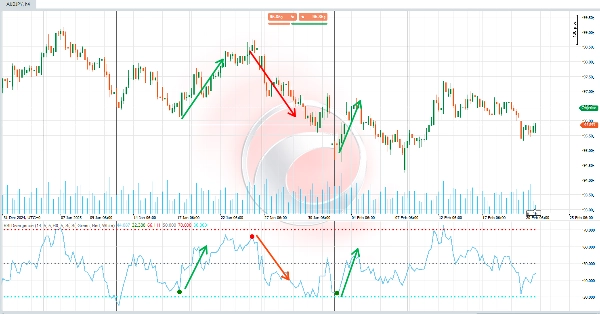
Tritt auf, wenn der Preis höhere Hochs bildet , aber der RSI niedrigere Hochs bildet . Dies deutet darauf hin, dass obwohl der Preis steigt, die Abwärtsdynamik an Boden gewinnen könnte, was möglicherweise zu einer Abwärtswende führt. ❌
Der Indikator erkennt diese Divergenzen automatisch und hebt sie im Chart mit Farben, Linien und Beschriftungen zur einfachen Interpretation hervor. 🎯
💡 Wofür wird es verwendet?
Dieser Indikator ist besonders nützlich für:
- Identifikation von Ein- und Ausstiegspunkten : Divergenzen können als Kauf- (bullisch) oder Verkaufssignale (bärisch) fungieren. 🛒💸
- Vorhersage von Trendwechseln : Divergenzen sind frühe Signale, dass der aktuelle Trend an Stärke verlieren könnte. ⚡
- Bestätigung technischer Analysen : Es kann zusammen mit anderen Indikatoren oder Kerzenmustern verwendet werden, um Handelsentscheidungen zu validieren. 🧠📊
Es ist ideal für sowohl Intraday-Trader als auch langfristige Investoren, da Divergenzen auf jedem Zeitrahmen anwendbar sind. ⏳📈
🛠️ Wie benutzt man es?
- Erste Einrichtung:
-
- Passen Sie die Parameter nach Ihren Bedürfnissen an, wie z.B. die RSI-Periode, Pivot-Suchbereiche und Signalfarben. 🎨⚙️
- Aktivieren oder deaktivieren Sie die Anzeige von bullischen oder bärischen Divergenzen basierend auf Ihren Präferenzen. ✅❌
- Interpretation der Signale:
-
- Bullische Divergenz : Wenn ein grünes "D"-Signal im Chart erscheint, weist dies auf eine mögliche Kaufgelegenheit hin. 🟩🛒
- Bärische Divergenz : Wenn ein rotes "D"-Signal im Chart erscheint, weist dies auf eine mögliche Verkaufsgelegenheit hin. 🟥🚫
- Zusätzlich werden Linien gezogen, die die Divergenzpunkte verbinden, um die visuelle Analyse zu erleichtern. 📐🔗
- Entscheidungsfindung:
-
- Nutzen Sie diese Signale, um Ihre Strategien anzupassen, wie z.B. das Öffnen von Positionen, das Schließen bestehender Trades oder das Anpassen von Stop-Loss-Niveaus. 🤝💼
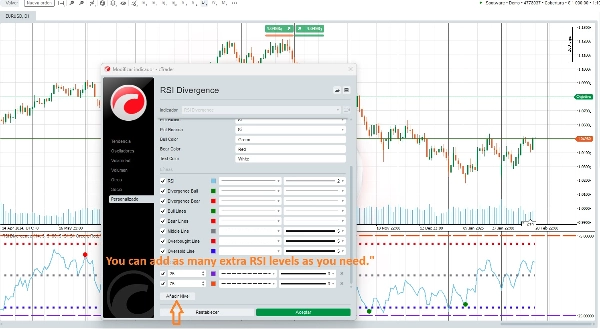
🆕 Erweiterte Anpassung!
🌟 Sie können so viele RSI-Level hinzufügen, wie der Benutzer möchte 🌟
Dieser Indikator ermöglicht es Ihnen, Ihr Handelserlebnis vollständig anzupassen. Sie können mehrere RSI-Level hinzufügen, um ihn an verschiedene Strategien und Handelsstile anzupassen. Zum Beispiel können Sie zusätzliche überkaufte und überverkaufte Niveaus konfigurieren oder sogar die RSI-Periode an verschiedene Zeitrahmen anpassen. 🔄📈📉
Zusammenfassung
Designed for use on any timeframe, the indicator helps traders identify entry and exit points, anticipate trend changes, and confirm other technical analysis signals. Users can customize parameters such as RSI period, pivot search ranges, signal colors, and enable or disable specific divergence types. Additionally, multiple RSI levels can be added to tailor the indicator to various trading strategies and styles.
This tool is suitable for intraday traders and long-term investors across markets including cryptocurrencies (e.g., BTCUSD), commodities (e.g., gold, XAUUSD), and indices. It supports enhanced decision-making by providing early warnings of trend strength shifts based on RSI divergence analysis.
Kundenbewertungen
5 | 0 % | |
4 | 100 % | |
3 | 0 % | |
2 | 0 % | |
1 | 0 % |