
Beschreibung
Verbesserter Unterstützungs- und Widerstandsindikator
Entfesseln Sie die Kraft der technischen Analyse mit unserem Verbesserten Unterstützungs- und Widerstandsindikator für cAlgo. Dieses fortschrittliche Tool wurde entwickelt, um Händlern zu helfen, kritische Unterstützungs- und Widerstandsniveaus in ihren Handelsdiagrammen zu identifizieren und zu visualisieren, wodurch die Entscheidungsfindung und Handelsstrategien verbessert werden.
Hauptmerkmale:
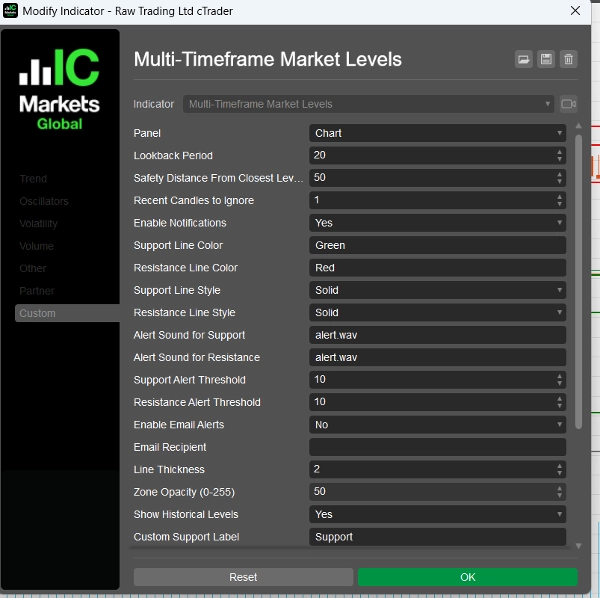
- Anpassbare Parameter: Passen Sie den Indikator an Ihren Handelsstil mit einstellbaren Einstellungen an, einschließlich Rückblickperioden, Sicherheitsabständen, Alarmtönen und mehr.
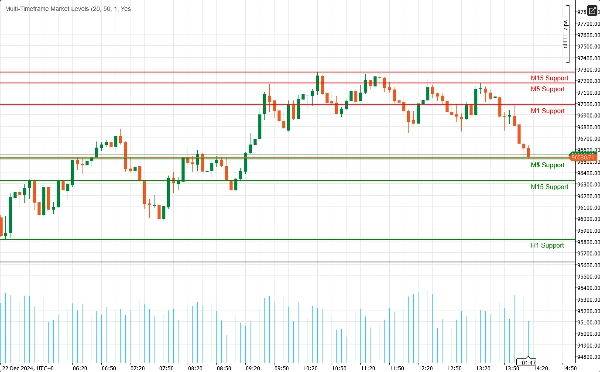
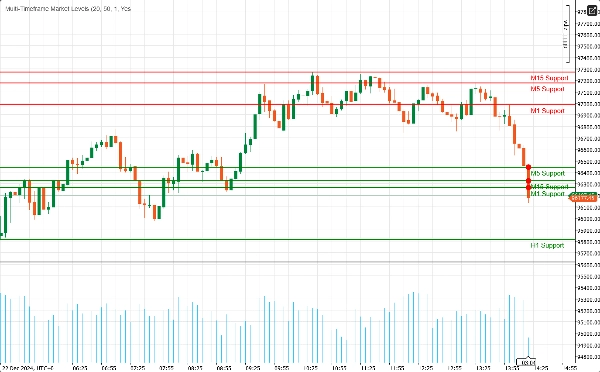
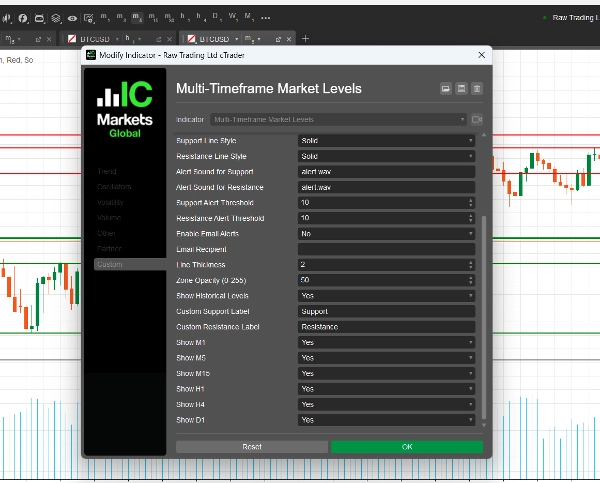
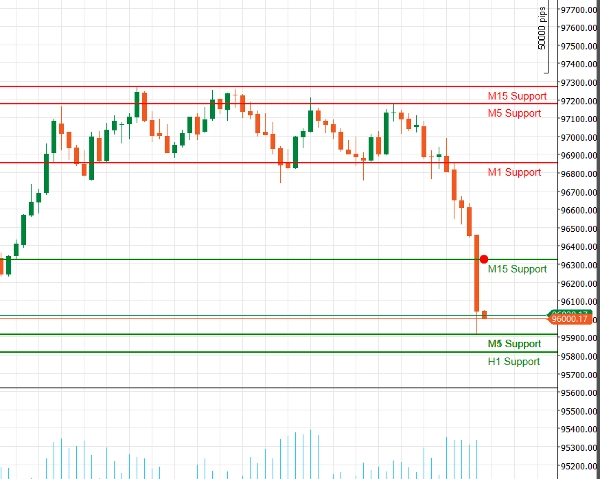
- Multi-Timeframe-Unterstützung: Analysieren Sie mehrere Zeitrahmen gleichzeitig (M1, M5, M15, H1, H4, D1), um einen umfassenden Überblick über die Marktdynamik zu erhalten und wichtige Niveaus über verschiedene Handelszeiträume hinweg zu identifizieren.
- Echtzeit-Benachrichtigungen: Bleiben Sie informiert mit sofortigen Benachrichtigungen! Der Indikator kann Audioalarme und E-Mail-Benachrichtigungen senden, wenn der Preis kritische Unterstützungs- oder Widerstandsniveaus erreicht, sodass Sie keine Handelsgelegenheit verpassen.
- Visuelle Klarheit: Genießen Sie klare visuelle Darstellungen von Unterstützungs- und Widerstandsniveaus, komplett mit anpassbaren Farben und Linienarten. Hervorgehobene Zonen bieten zusätzlichen Kontext und erleichtern das Erkennen potenzieller Umkehrpunkte.
- Fibonacci-Integration: Verbessern Sie Ihre Analyse mit integrierter Fibonacci-Linienzeichnung, die es Ihnen ermöglicht, potenzielle Retracement- und Erweiterungsniveaus in Verbindung mit Unterstützung und Widerstand zu identifizieren.
- Benutzerfreundliche Oberfläche: Entwickelt für sowohl Anfänger als auch erfahrene Händler, ist der Indikator einfach einzurichten und lässt sich nahtlos in Ihre bestehende cAlgo-Umgebung integrieren.
Wie man den verbesserten Unterstützungs- und Widerstandsindikator verwendet
- Installation:
-
- Laden Sie den Indikator herunter und importieren Sie ihn in Ihre cAlgo-Plattform.
- Fügen Sie den Indikator dem gewünschten Chart hinzu.
- Parameter konfigurieren:
-
- Passen Sie die Einstellungen an Ihren Handelsstil an. Legen Sie die Rückblickperiode, den Sicherheitsabstand fest und wählen Sie Ihre bevorzugten Farben und Linienarten für Unterstützungs- und Widerstandsniveaus.
- Aktivieren Sie Benachrichtigungen, wenn Sie Alarme erhalten möchten, wenn der Preis diese Niveaus erreicht.
- Zeitrahmen auswählen:
-
- Wählen Sie aus, welche Zeitrahmen Sie anzeigen möchten. Sie können entscheiden, ob Sie Niveaus von M1, M5, M15, H1, H4 und D1 je nach Ihrer Handelsstrategie anzeigen oder ausblenden möchten.
- Chart analysieren:
-
- Beobachten Sie die auf Ihrem Chart eingezeichneten Unterstützungs- und Widerstandsniveaus. Diese Niveaus zeigen an, wo der Preis wahrscheinlich umkehren oder konsolidieren wird.
Wie man mit dem verbesserten Unterstützungs- und Widerstandsindikator handelt
- Einstiegspunkte identifizieren:
-
- Long-Trades: Suchen Sie nach Kaufgelegenheiten, wenn der Preis sich einem Unterstützungsniveau nähert, besonders wenn Anzeichen einer Erholung sichtbar sind (z. B. bullische Kerzenmuster).
- Short-Trades: Ziehen Sie einen Verkauf in Betracht, wenn der Preis sich einem Widerstandsniveau nähert, insbesondere wenn es bärische Signale gibt (z. B. bärische Kerzenmuster).
- Alarme verwenden:
-
- Nutzen Sie die Echtzeit-Alarme, um benachrichtigt zu werden, wenn der Preis wichtige Unterstützungs- oder Widerstandsniveaus erreicht. So können Sie schnell reagieren und potenzielle Handelsmöglichkeiten nutzen.
- Kombination mit anderen Indikatoren:
-
- Verbessern Sie Ihre Strategie, indem Sie den verbesserten Unterstützungs- und Widerstandsindikator mit anderen technischen Indikatoren (z. B. gleitende Durchschnitte, RSI, MACD) kombinieren, um Signale zu bestätigen und die Genauigkeit Ihrer Trades zu erhöhen.
- Stop-Loss- und Take-Profit-Niveaus festlegen:
-
- Platzieren Sie Stop-Loss-Orders knapp unter den Unterstützungsniveaus für Long-Trades und knapp über den Widerstandsniveaus für Short-Trades, um das Risiko zu steuern.
- Setzen Sie Take-Profit-Ziele am nächsten signifikanten Unterstützungs- oder Widerstandsniveau, um potenzielle Gewinne zu maximieren.
Warum den verbesserten Unterstützungs- und Widerstandsindikator wählen?
Die Komplexität der Finanzmärkte zu navigieren kann herausfordernd sein. Der Verbesserte Unterstützungs- und Widerstandsindikator stattet Sie mit den Werkzeugen aus, die Sie benötigen, um wichtige Preisniveaus zu identifizieren und fundierte Handelsentscheidungen zu treffen. Egal, ob Sie Daytrader oder langfristiger Investor sind, dieser Indikator ist eine unverzichtbare Ergänzung für Ihr Handelsarsenal.
Zusammenfassung
Kundenbewertungen
5 | 100 % | |
4 | 0 % | |
3 | 0 % | |
2 | 0 % | |
1 | 0 % |


