
Beschreibung
⚡ Hauptmerkmale
- Dynamische Zonenerkennung
-
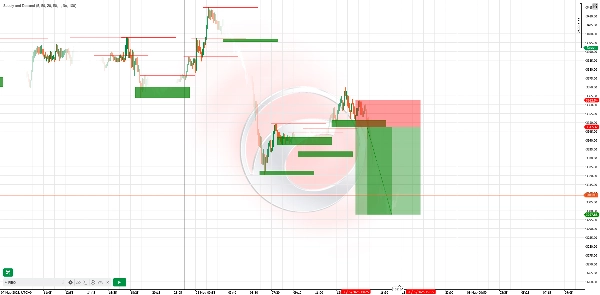
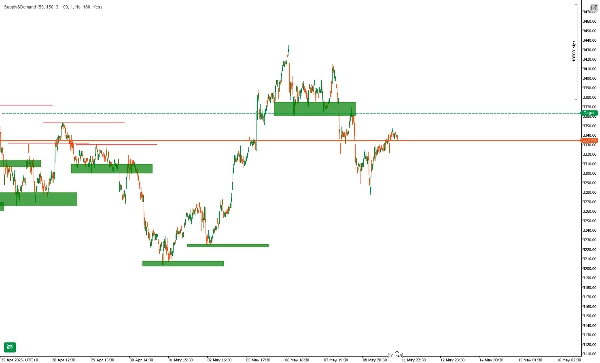
- Erkennt automatisch Swing-Hochs/-Tiefs und zeichnet Angebots- (Widerstands-) & Nachfrage- (Unterstützungs-) Zonen in Echtzeit.
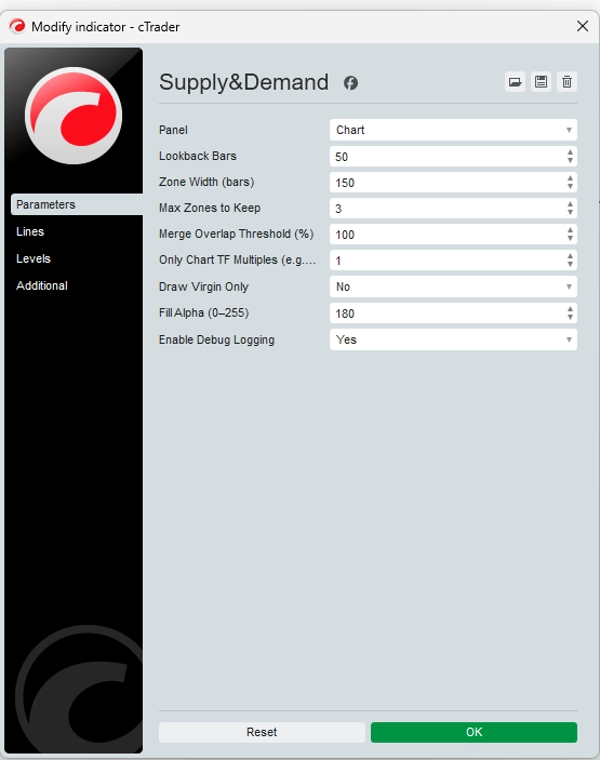
- Konfigurierbare Lookback- & Zonenbreiten-Parameter ermöglichen die Anpassung der Empfindlichkeit für jeden Markt oder Zeitrahmen.
- Hervorhebung unberührter Zonen
-
- Frische „unberührte“ Zonen (nie vom Preis berührt) werden visuell hervorgehoben – handeln Sie dort, wo Institutionen Aufträge platziert haben.
- Optional können berührte Zonen ausgeblendet werden, um Ihr Chart übersichtlich zu halten.
- Multi-Zeitrahmen-Filterung
-
- Zeigt nur Zonen an, die mit dem Vielfachen des Zeitrahmens Ihres Charts übereinstimmen (z. B. tägliche Zonen im 1-Stunden-Chart).
- Schnelle Erkennung der Übereinstimmung von Angebots-/Nachfragezonen höherer Zeitrahmen mit Ihrem Intraday-Setup.
- Nicht nachzeichnend & ohne Verzögerung
-
- Zonen sind nach dem Zeichnen fixiert – keine verschwindenden oder verschiebenden Linien nach Kursbewegungen.
- Bewährte Zuverlässigkeit: Zonen bleiben statisch, was Ihnen Vertrauen in die historische Analyse gibt.
- Benutzerdefinierte Alarme & Protokollierung
-
- Erhalten Sie Pop-up- oder E-Mail-Benachrichtigungen, wenn der Preis eine Zone betritt oder durchbricht.
- Detailliertes Debug-Protokoll zeigt Zonenerstellung, übersprungene Überlappungen und Zonenkontakte.
🚀 Funktionsweise
- Pivot-Erkennung: Der Indikator scannt jede neue Kerze nach Pivot-Hochs (Angebot) und Pivot-Tiefs (Nachfrage) basierend auf Ihrem gewählten Lookback.
- Zonenkonstruktion: Für jeden Pivot wird eine rechteckige Zone nach vorne gezeichnet – zur Hervorhebung, wo Institutionen wahrscheinlich Limit-Orders platziert haben.
- Überlappungsfilter: Zonen, die über Ihren Schwellenwert hinaus überlappen, werden zusammengeführt oder übersprungen, sodass nur die bedeutendsten Bereiche verbleiben.
- Nur unberührte Zonen Option: Zeigt nur unberührte Zonen an, um sich auf die frischesten institutionellen Niveaus zu konzentrieren.
🎯 Beispielhafte Handelsstrategien
StrategieZeitrahmenEinstiegStop‑LossTake‑Profit
Zonenabweisung
H1
Warten Sie, bis der Preis in eine Nachfragezone steigt und eine bärische Kerze (Engulfing/Pin Bar) in der Angebotszone zeigt
Knapp außerhalb der Zonengrenze
1,5× Zonenhöhe
Zeitrahmen-Übereinstimmung
M15 + H4
Identifizieren Sie die H4-Nachfragezone, wechseln Sie dann zu M15 für eine bullische Momentum-Kerze innerhalb dieser Zone
Unterhalb des Tiefs der H4-Zone
Nächstes H4-Swing-Hoch
Durchbruch & Retest
H4
Nachdem der Preis eine Angebotszone durchbricht, warten Sie auf den Retest der Unterseite der Zone und eine bärische Bestätigung
Oberhalb des Zonen-Tops
Jüngstes H4-Tief
Nutzungstipp: Kombinieren Sie mit RSI- oder MACD-Divergenzen innerhalb der Zonen für Signale mit höherer Wahrscheinlichkeit.
📈 Praxisbeispiel
- Beim EURUSD H4 zeichnet der Indikator eine Nachfragezone bei 1,0950–1,0980.
- Der Preis fällt in die Zone, bildet eine bullische M15-Engulfing-Kerze.
- Einstieg bei 1,0970, Stop bei 1,0945 (unterhalb der Zone), Ziel bei 1,1040 (nächster H4-Widerstand).
- Ergebnis: +70 Pips (~6,4× Risiko).
⚠️ Haftungsausschluss
Dieser Indikator ist ein Werkzeug – kein garantiertes Gewinnsystem. Vergangene Leistungen garantieren keine zukünftigen Ergebnisse. Verwenden Sie stets ein angemessenes Risikomanagement (z. B. max. 2 % pro Trade), testen Sie zuerst auf einem Demokonto und kombinieren Sie mit Ihrer eigenen Analyse. Trading birgt Verlustrisiken; handeln Sie nur mit Kapital, dessen Verlust Sie verkraften können.
Zusammenfassung
It supports multi-timeframe filtering, allowing users to display zones aligned with higher timeframe multiples on lower timeframe charts, facilitating confluence analysis. Zones are non-repainting and non-lagging; once drawn, they remain fixed, ensuring reliable historical analysis. Custom alerts notify users when price enters or breaks these zones, and detailed logs track zone creation and interactions.
The indicator operates by scanning each new bar for pivot highs and lows, constructing rectangular zones extending forward, and filtering overlapping zones to retain the most significant areas. It offers a “virgin-only” mode to focus on fresh institutional levels.
Example strategies include zone rejection, multi-timeframe confluence, and break & retest setups, often combined with RSI or MACD divergence for higher-probability signals. A real-world example on EURUSD H4 demonstrates entry, stop-loss, and take-profit placement based on demand zones and candlestick confirmation.
Kundenbewertungen
5 | 75 % | |
4 | 25 % | |
3 | 0 % | |
2 | 0 % | |
1 | 0 % |


![„[Hamster-Coder] Bollinger Bands“-Logo](https://cdn.ctrader.com/image/webp/21d8e5d6-fb11-4bac-b9ee-cd05c2b76804_30327)


