
Penerangan
ICT Killzones Lengkap – Analisis Sesi Perdagangan Profesional
Kuasi masa perdagangan institusi dengan penunjuk ICT Killzones yang paling komprehensif untuk cTrader. Alat tahap profesional ini secara automatik mengenal pasti dan memvisualisasikan semua lima sesi perdagangan ICT (Inner Circle Trader) yang kritikal, memberikan anda kelebihan untuk berdagang bersama wang pintar.
Apa Yang Baru Dalam Versi Ini:
- Semua 5 Sesi ICT: Liputan lengkap termasuk Julat Asia, Zon Bunuh London, Zon Bunuh New York, Zon Makan Tengah Hari/ Pembalikan NY, dan Zon Bunuh NY PM
- Sistem Warna Pintar: Nama warna mudah (Merah, Biru, Jingga) menggantikan kod ARGB yang kompleks
- Kawalan Ketelusan Bebas: Laraskan kelegapan untuk setiap sesi (0-100%)
- Warna Label Khusus Sesi: Sesuaikan warna label secara bebas daripada warna zon
- Penerangan Sesi: Label maklumat pilihan yang menerangkan ciri-ciri setiap sesi
- Prestasi Dipertingkatkan: Kod dioptimumkan dengan pembersihan automatik zon lama
Ciri-ciri Utama:
📊 Liputan Sesi Lengkap:
- Julat Asia (19:00-00:00 NY): Mengenal pasti zon pengukuhan dan kolam kecairan untuk serangan kemudian
- Zon Bunuh London (02:00-05:00 NY): Menandakan lonjakan volatiliti utama yang sesuai untuk pemburuan hentian dan pembalikan
- Zon Bunuh NY (07:00-10:00 NY): Menonjolkan pergerakan utama kedua dengan momentum kuat
- Zon Makan Tengah Hari NY (12:00-13:30 NY): Menunjukkan tempoh pembalikan dan pengukuhan
- Zon Bunuh NY PM (13:30-16:00 NY): Menangkap pergerakan sekunder dan penyesuaian semula pasaran
🎨 Penyesuaian Warna Mudah:
- Nama warna mudah: hanya taip "Biru", "Jingga", "Ungu", dan sebagainya.
- 50+ warna yang telah ditetapkan termasuk DodgerBlue, BlueViolet, MediumAquamarine
- Sokongan warna Hex (#RRGGBB format)
- Gelangsar ketelusan individu (0-100%) untuk setiap zon
- Warna label berasingan untuk kejelasan maksimum
⚙️ Pilihan Paparan Berkuasa:
- Togol sesi individu hidup/mati
- Tunjuk/sembunyi label maklumat sesi
- Saiz fon boleh laras (6-20)
- Lanjutkan zon ke tepi carta atau kekalkan dalam
- Kawal berapa hari sejarah untuk dipaparkan (1-30 hari)
- Pembersihan automatik mengelakkan kekacauan carta
🎯 Reka Bentuk Profesional:
- Visualisasi bersih, tidak mengganggu
- Penjejakan tinggi/rendah dinamik semasa sesi aktif
- Pengendalian betul sesi semalaman
- Berfungsi pada semua jangka masa
- Tiada kelewatan, prestasi dioptimumkan
Sesuai Untuk:
- Pedagang metodologi ICT yang mencari ketepatan masa
- Pedagang wang pintar yang mengikuti aliran institusi
- Pedagang harian dan scalper yang memerlukan sempadan sesi tepat
- Pedagang swing yang mengenal pasti zon pembalikan utama
- Sesiapa yang ingin menyelaraskan perdagangan dengan sesi pasaran utama
Cara Ia Berfungsi:
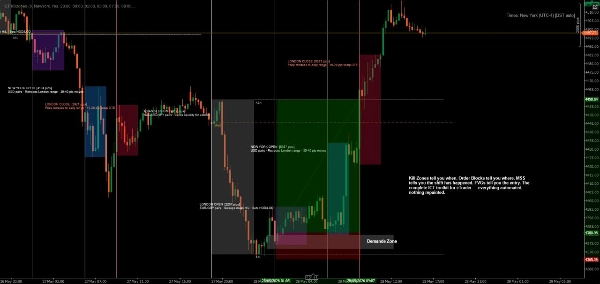
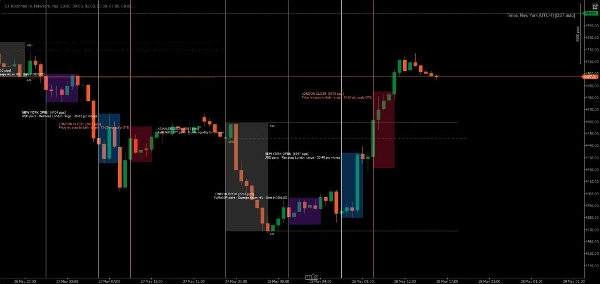
Penunjuk secara automatik mengesan setiap hari perdagangan dan mencipta zon berwarna untuk semua lima sesi ICT. Apabila harga bergerak melalui setiap sesi, penunjuk menjejaki tinggi dan rendah, kemudian melukis zon akhir apabila sesi ditutup. Label jelas mengenal pasti setiap sesi dan secara pilihan memaparkan ciri perdagangan sesi tersebut.
Semua masa adalah dalam waktu New York (Timur), mengikut metodologi ICT standard.
Contoh Penyesuaian:
- Tetapan Konservatif: Ketelusan rendah (20-30%), warna lembut, tiada maklumat sesi
- Tetapan Berani: Ketelusan tinggi (70-80%), warna terang, penerangan sesi penuh
- Tetapan Minimum: Matikan sesi yang tidak diingini, kekalkan hanya killzones pilihan anda
- Strategi Berwarna Kod: Padankan warna zon dengan bias perdagangan anda (hijau = panjang, merah = pendek)
Keperluan Sistem:
- Platform: cTrader Desktop (produk Kedai cTrader tidak disokong pada versi Web atau Mudah Alih) blog.ctrader.com
- Sistem Operasi: Windows 7 atau lebih tinggi
- Pemproses: CPU dual-core disyorkan
- Memori: Minimum 2 GB RAM (4 GB disyorkan)
- Sambungan Internet: 50 kB sesaat atau lebih pantas
Arahan Pemasangan:
- Beli/Pasang: Dapatkan penunjuk dari Kedai cTrader
- Muat Turun cTrader Desktop: Jika belum dipasang, muat turun dari ctrader.com
- Log Masuk: Buka cTrader Desktop dan log masuk dengan ID cTrader anda
- Akses Penunjuk: Navigasi ke bahagian "Algo" → senarai "Indicators"
- Tambah ke Carta: Klik kanan mana-mana carta → "Indicators" → Pilih "ICT Killzones Complete"
- Sesuaikan: Klik kanan nama penunjuk pada carta → "Settings" untuk laraskan warna, masa, dan pilihan paparan
Petua untuk Keputusan Terbaik:
- Gunakan pada jangka masa 1 minit hingga 1 jam untuk keterlihatan optimum
- Gabungkan dengan konsep tindakan harga dan kecairan untuk hasil terbaik
- Laraskan masa sesi jika broker anda menggunakan zon masa berbeza
- Cuba ketelusan untuk mencari keseimbangan visual sempurna anda
- Aktifkan label maklumat sesi semasa belajar, matikan untuk carta lebih kemas
Berdagang dengan ketepatan. Berdagang dengan keyakinan. Berdagang cara ICT.
Nota: Penunjuk ini adalah untuk tujuan pendidikan dan maklumat. Prestasi lalu tidak menjamin keputusan masa depan. Sentiasa amalkan pengurusan risiko yang betul.
Ringkasan
The indicator tracks high and low prices during active sessions and finalizes zones upon session close, providing clear visual boundaries for institutional trading timing. It supports all timeframes, handles overnight sessions properly, and includes automatic cleanup of old zones to maintain chart clarity. Customization options include font size adjustment, zone extension control, and history length for displayed zones. ICT Killzones Complete is suitable for traders using ICT methodology, smart money concepts, scalping, day trading, and swing trading across markets such as Forex, commodities, and crypto. It requires cTrader Desktop on Windows 7 or higher with recommended hardware specifications.
Ulasan pelanggan
5 | 50 % | |
4 | 25 % | |
3 | 0 % | |
2 | 25 % | |
1 | 0 % |


