
Penerangan
✅ Lancar garis tren berubah warna yang menyesuaikan dengan serta-merta mengikut arah
✅ Pilihan anak panah naik & turun untuk isyarat peralihan tren yang jelas
✅ Menapis bunyi untuk menyerlahkan peralihan tren yang bersih dan boleh dipercayai
✅ Sesuai untuk mengikuti tren, penarikan balik, dan pembalikan
✅ Boleh disesuaikan sepenuhnya: tempoh, kepekaan & paparan anak panah
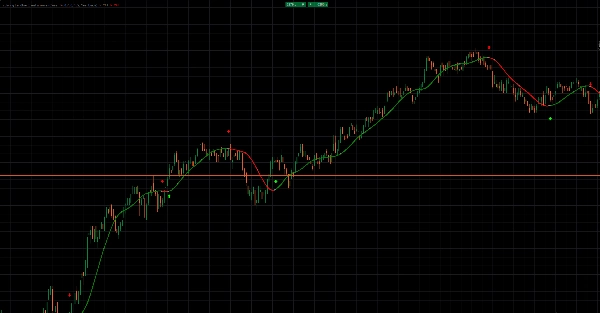
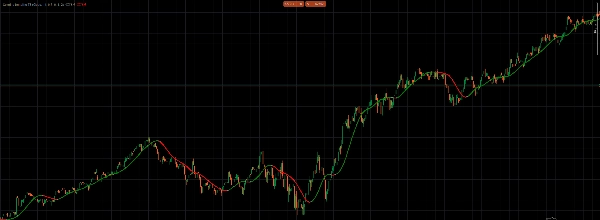
The Coloring Trendline with Arrows memberikan pandangan pasaran yang lancar dan responsif tanpa kekacauan.
Garis tren berubah secara dinamik hijau dalam fasa menaik dan merah dalam fasa menurun, menjadikan arah tren mudah dibaca serta-merta.
Apabila momentum berubah, anak panah pilihan menandakan perubahan — anak panah hijau untuk tren menaik, anak panah merah untuk tren menurun.
Ini membolehkan anda menangkap titik perubahan tren lebih awal sambil mengelakkan isyarat palsu yang disebabkan oleh bunyi pasaran.
Direka untuk kejelasan, ia menyesuaikan dengan lancar kepada harga sambil mengekalkan struktur arah yang kukuh.
Sesuai untuk menentukan masa kemasukan, menguruskan keluar, dan kekal selari dengan tren dominan.
Gunakan ia sebagai alat tren berdiri sendiri atau gabungkan dengan strategi sedia ada anda untuk pengesahan tambahan.
Visual yang bersih. Isyarat yang jelas. Perdagangan tren yang yakin.
Ringkasan
Ulasan pelanggan
5 | 0 % | |
4 | 100 % | |
3 | 0 % | |
2 | 0 % | |
1 | 0 % |


![Logo "[Hamster-Coder] Pivot Points MTF"](https://cdn.ctrader.com/image/webp/4c143e5a-309c-40e3-a578-f04d1e133ffa_31159)


