
Penerangan
| ALL IN ONE TRADING PRO|
## Apakah Penunjuk Ini?
Penunjuk ini meletakkan **tiga alat perdagangan yang berguna** pada carta anda sekaligus. Fikirkan ia seperti mempunyai tiga pedagang pakar yang memberikan pendapat mereka pada masa yang sama
=====================================================
## Tiga Alat
### 1. PAPAN PEMANDU TREND (Penjejak Trend)
**Apa yang dilakukannya:** Memberitahu anda arah pasaran bergerak dan betapa kuatnya pergerakan itu.
**Apa yang anda lihat:**
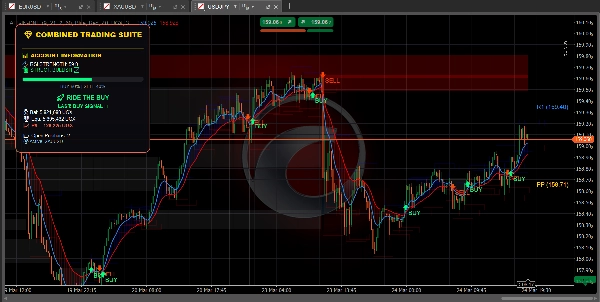
- **Garis biru** = Purata bergerak pantas (trend jangka pendek)
- **Garis merah** = Purata bergerak perlahan (trend jangka panjang)
- **Awan biru** = Trend menaik (harga naik)
- **Awan merah** = Trend menurun (harga turun)
- **Anak panah hijau** = Isyarat BELI muncul
- **Anak panah merah** = Isyarat JUAL muncul
- **Bar RSI** = Menunjukkan jika pasaran terlebih beli (terlalu tinggi) atau terlebih jual (terlalu rendah)
========================================================
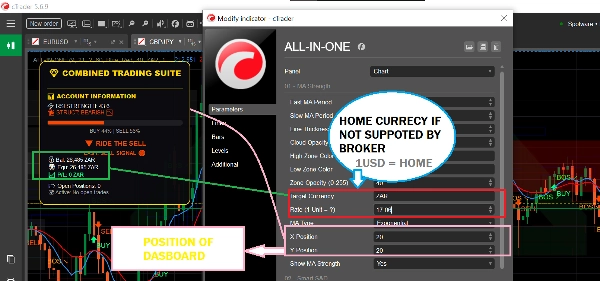
**Juga menunjukkan:**
- Baki akaun dan untung/rugi anda
- Berapa banyak posisi yang anda buka
- Nasihat teks mudah seperti "SELAMAT UNTUK BELI" atau "IKUT BELI"
============================================================
### 2. ZON BEKALAN & PERMINTAAN (Pencari Tahap Utama)
**Apa yang dilakukannya:** Mencari tahap harga penting di mana pasaran mungkin berbalik atau berhenti.
**Apa yang anda lihat:**
- **Kotak biru** = Zon permintaan (kawasan di mana pembeli masuk - BAIK untuk membeli)
- **Kotak merah** = Zon bekalan (kawasan di mana penjual masuk - BAIK untuk menjual)
- **Kotak kelabu** = Zon yang telah diuji (kurang boleh dipercayai)
============================================================
**Cara menggunakan:**
- Harga turun ke arah kotak biru? Cari untuk BELI
- Harga naik ke arah kotak merah? Cari untuk JUAL
- Kotak segar (cerah) berfungsi lebih baik daripada yang kelabu
============================================================
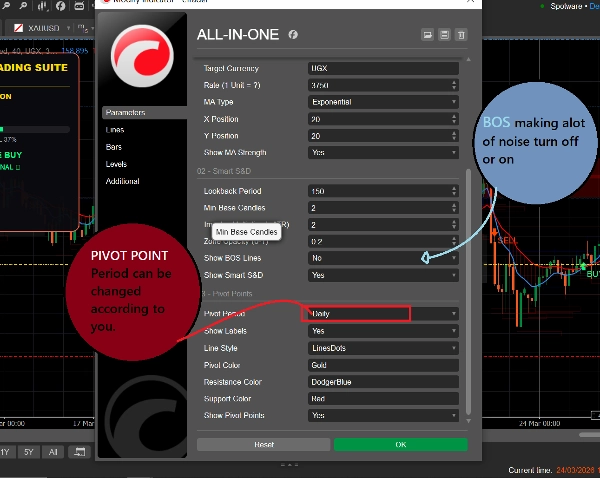
**Juga menunjukkan:**
- **BOS ↗** = Pasaran pecah ke atas, trend mungkin berterusan naik
- **BOS ↘** = Pasaran pecah ke bawah, trend mungkin berterusan turun
============================================================
### 3. TITIK PIVOT (Tahap Sokongan & Rintangan)
**Apa yang dilakukannya:** Mengira tahap harga automatik di mana pasaran sering berhenti atau berbalik.
**Apa yang anda lihat:**
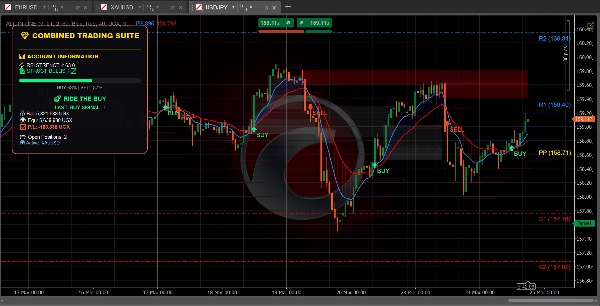
- **Garis emas** = Titik pivot (tahap pusat)
- **Garis biru** = Tahap rintangan (harga mungkin turun di sini)
- **Garis merah** = Tahap sokongan (harga mungkin naik di sini)
============================================================
**Anda boleh memilih:**
- **Harian** = Tahap berubah sekali sehari
- **Mingguan** = Tahap berubah sekali seminggu
- **Bulanan** = Tahap berubah sekali sebulan
- **15-Minit** = Tahap berubah setiap 15 minit (baik untuk perdagangan pantas)
============================================================
## Cara Menggunakannya (Mudah)
### Untuk Mencari Perdagangan BELI:
1. Tunggu harga mencapai **kotak permintaan biru**
2. Periksa jika garis MA biru berada di atas garis MA merah (trend menaik)
3. Isyarat hanya harus diikuti jika pasaran berada dalam trend yang betul
============================================================
### Untuk Mencari Perdagangan JUAL:
1. Tunggu harga mencapai **kotak bekalan merah**
2. Periksa jika garis MA merah berada di atas garis MA biru (trend menurun)
3. Isyarat hanya harus diikuti jika pasaran berada dalam trend yang betul
============================================================
### Untuk Mencari Perdagangan Pantas:
1. Gunakan titik pivot 15-minit untuk tahap yang tepat
2. Perhatikan anak panah BOS untuk arah trend
3. Periksa papan pemuka untuk kekuatan pasaran
4. Ambil perdagangan yang sepadan dengan arah
============================================================
## Apa Maksud Semua Warna
| Warna | Maksudnya |
| 🟦 Biru | Isyarat Bullish / Beli / Zon permintaan / Pivot rintangan |
| 🔴 Merah | Isyarat Bearish / Jual / Zon bekalan / Pivot sokongan |
| 🟨 Emas | Titik pivot (tahap pusat) |
| ⚪ Kelabu | Zon yang telah diuji (sudah dilawati) |
| 🟢 Anak Panah Hijau | Isyarat BELI |
| 🔴 Anak Panah Merah | Isyarat JUAL |
============================================================
## Tetapan Mudah untuk Pemula
============================================================
### Untuk Perdagangan Pantas (Scalping):
- Tempoh Pivot: **15-Minit**
- MA Pantas: **5**
- MA Perlahan: **13**
- Hidupkan: Ketiga-tiga alat
============================================================
### Untuk Perdagangan Harian:
- Tempoh Pivot: **Harian**
- MA Pantas: **9**
- MA Perlahan: **21**
- Hidupkan: Ketiga-tiga alat
============================================================
### Untuk Perdagangan Jangka Panjang:
- Tempoh Pivot: **Mingguan**
- MA Pantas: **21**
- MA Perlahan: **55**
- Hidupkan: Papan Pemuka Trend + Titik Pivot
=========================================================
## Satu Peraturan untuk Diingat
=========================================================
**Jangan berdagang apabila alat tidak sependapat!**
Jika papan pemuka mengatakan BELI, tetapi harga berada di zon bekalan merah - tunggu kejelasan.
Jika papan pemuka mengatakan JUAL, tetapi harga berada di zon permintaan biru - tunggu kejelasan.
Perdagangan terbaik berlaku apabila KETIGA-TIGA alat menunjukkan arah yang sama.
============================================================
## Mula dengan Cepat
1. Tambah penunjuk ke carta anda
2. Kekalkan semua tetapan pada lalai untuk mula
3. Perhatikan bagaimana harga berkelakuan pada kotak dan garis berwarna
4. Selepas beberapa hari, laraskan tetapan mengikut gaya anda
5. Gunakan papan pemuka untuk memantau akaun anda secara masa nyata
============================================================
Itu sahaja! Tiga alat, satu penunjuk, perdagangan mudah.
Ringkasan
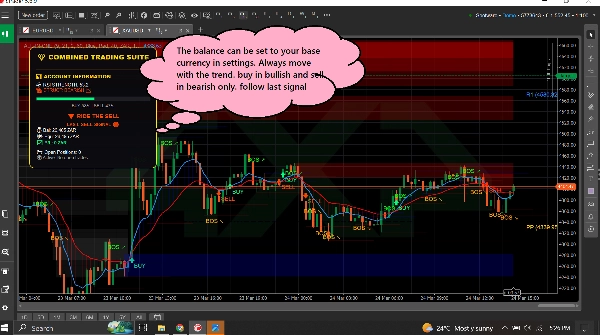
1. Trend Dashboard: Displays short-term (blue line) and long-term (red line) moving averages, colored clouds indicating uptrend (blue) or downtrend (red), buy (green arrow) and sell (red arrow) signals, and an RSI bar showing overbought or oversold conditions. It also shows account balance, open positions, and simple text advice.
2. Supply & Demand Zones: Highlights important price levels with blue boxes for demand zones (buying areas), red boxes for supply zones (selling areas), and gray boxes for tested zones (less reliable). It includes breakout signals (BOS arrows) indicating potential trend continuation.
3. Pivot Points: Automatically calculates support and resistance levels with a gold pivot point line, blue resistance lines, and red support lines. Users can select pivot periods from 15-minute to monthly intervals for different trading styles.
The indicator supports multiple markets including Forex, Crypto, Stocks, and Indices, and provides visual signals such as crossovers, breakouts, and level touches. It is designed for various trading styles, from scalping to long-term trading, with recommended settings for each. The tool emphasizes trading only when all three components align in direction to improve trade clarity and consistency.
Ulasan pelanggan
5 | 100 % | |
4 | 0 % | |
3 | 0 % | |
2 | 0 % | |
1 | 0 % |


