
Simple ICT Concepts
Chỉ báo
3 lượt mua
Phiên bản 1.0, Dec 2025
Windows, Mac
4.0
Đánh giá: 1
Mô tả
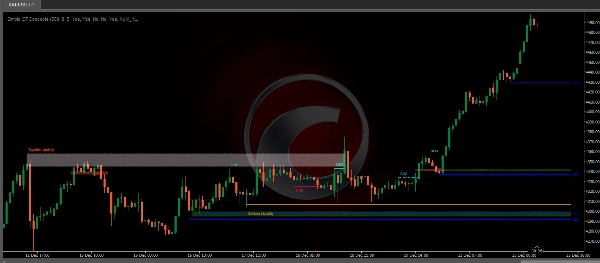
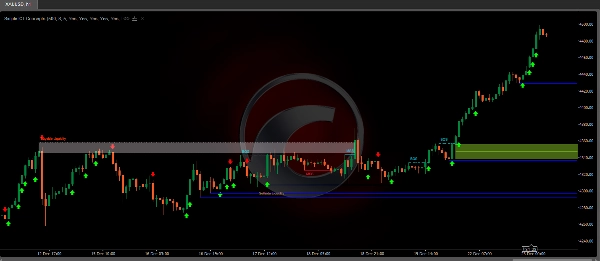
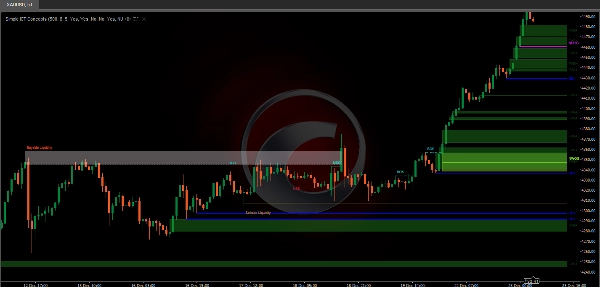
Chỉ báo Simple ICT Concepts là một công cụ mạnh mẽ được thiết kế để giúp các nhà giao dịch áp dụng các nguyên tắc của phương pháp Inner Circle Trader (ICT). Chỉ báo này tập trung vào việc xác định các vùng quan trọng như mức thanh khoản, hỗ trợ và kháng cự, cũng như cấu trúc thị trường, làm cho nó trở thành một tài sản vô giá đối với các nhà giao dịch hành động giá và khái niệm tiền thông minh.
Các tính năng chính
Cấu trúc thị trường:
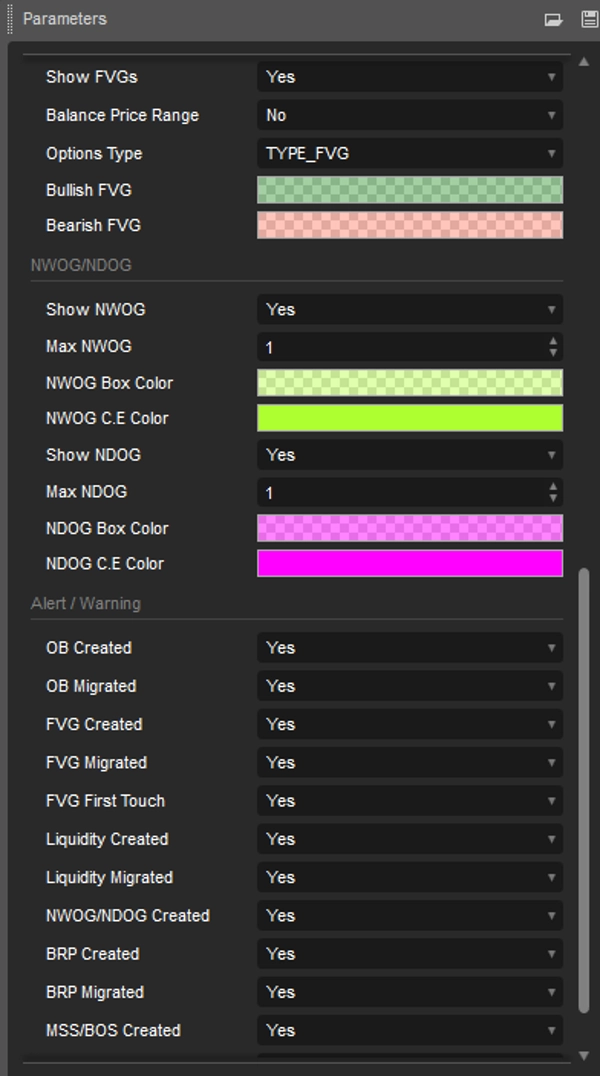
Nhãn cấu trúc thị trường được xây dựng từ việc giá phá vỡ điểm swing trước đó. Điều này cho phép người dùng xác định xu hướng thị trường hiện tại dựa trên hành động giá.Có hai loại nhãn Cấu trúc Thị trường được bao gồm:Chuyển đổi Cấu trúc Thị trường (MSS)Phá vỡ Cấu trúc (BOS)Một MSS xảy ra khi giá phá vỡ đáy swing trong xu hướng tăng hoặc đỉnh swing trong xu hướng giảm, làm nổi bật khả năng đảo chiều.Điều này thường được gọi là "CHoCH", nhưng ICT xác định nó là MSS. Ngược lại, nhãn BOS xảy ra khi giá phá vỡ đỉnh swing trong xu hướng tăng hoặc đáy swing trong xu hướng giảm.Sự xuất hiện của các điểm swing cụ thể này là do các đợt hồi lại (kích thích) làm nổi bật việc săn thanh khoản trong các khung thời gian thấp hơn.Các điểm swing chính: Đỉnh cao hơn (HH) và đáy thấp hơn (LL), đáy cao hơn (HL) và đỉnh thấp hơn (LH)Dịch chuyển:Dịch chuyển là các kịch bản nơi giá hình thành các cây nến liên tiếp cùng xu hướng (tăng/giảm) với thân nến lớn và bóng nến ngắn.Điều này có thể được xác định kỹ thuật hơn bằng tự tương quan dương (sự thay đổi đóng cửa đến mở cửa có khả năng được theo sau bởi sự thay đổi cùng dấu) cũng như cụm biến động (các thay đổi lớn được theo sau bởi các thay đổi lớn).Dịch chuyển có thể là nguyên nhân hình thành mất cân bằng cũng như cấu trúc thị trường, điều này có thể do việc thực hiện đầy đủ một lệnh meta.Mất cân bằng Khối lượng:Mất cân bằng Khối lượng (V.I.) xảy ra khi có một vùng giá bị bỏ trống không có thân nến. Có sự chuyển động lên xuống trong phần chồng lấp của bóng nến, tuy nhiên vì phần lớn khối lượng nằm trong thân nến, chúng tôi gọi đây là Mất cân bằng Khối lượng.Khối Lệnh:Khối lệnh ICT (Inner Circle Trader) là một vùng giá trên biểu đồ nơi các nhà đầu tư tổ chức lớn đặt các lệnh mua hoặc bán đáng kể. Khối lệnh là một khái niệm quan trọng trong giao dịch, vì chúng giúp các nhà giao dịch xác định các mức hỗ trợ và kháng cự tiềm năng, cũng như dự đoán các điểm đảo chiều giá.Thanh khoản:Các mức thanh khoản bên mua/bán làm nổi bật các mức giá nơi các thành viên thị trường có thể đặt các lệnh giới hạn/dừng.Mức thanh khoản bên mua sẽ tập hợp các lệnh dừng lỗ của các nhà giao dịch bán khống cũng như các lệnh giới hạn của nhà giao dịch mua, trong khi mức thanh khoản bên bán sẽ tập hợp các lệnh dừng lỗ của nhà giao dịch mua cũng như các lệnh giới hạn của nhà giao dịch bán khống.Các mức này có thể đóng vai trò khác nhau. Những người tham gia thị trường có thông tin hơn có thể xem các mức này là nguồn thanh khoản, và khi thanh khoản trên một mức cụ thể giảm, nó sẽ được tìm thấy ở khu vực khác.FVG/IFVG:Khoảng cách Giá Công bằng: Một cấu trúc ba cây nến nơi bóng nến liền kề với cây nến trung tâm không chồng lấp, điều này làm nổi bật một vùng khoảng trống.Khoảng cách Giá Công bằng Ngụ ý: Khác với khoảng cách giá công bằng, khoảng cách giá công bằng ngụ ý có bóng nến liền kề với cây nến trung tâm chồng lấp. Vùng khoảng trống được xây dựng từ trung bình giữa bóng nến tương ứng và điểm cực gần nhất của thân nến.Phạm vi Giá Cân bằng: Phạm vi giá cân bằng xảy ra khi một khoảng cách giá công bằng chồng lấp một khoảng cách giá công bằng trước đó, với vùng chồng lấp tạo thành vùng mất cân bằng.NWOG/NDOG:Chỉ báo này tiết lộ các khoảng trống mở cửa tuần mới (NWOG) và khoảng trống mở cửa ngày mới (NDOG). NWOG là khoảng trống giữa giá đóng cửa thứ Sáu và giá mở cửa Chủ Nhật. NDOG là khoảng trống giữa giá mở cửa và giá đóng cửa của ngày trước đó.
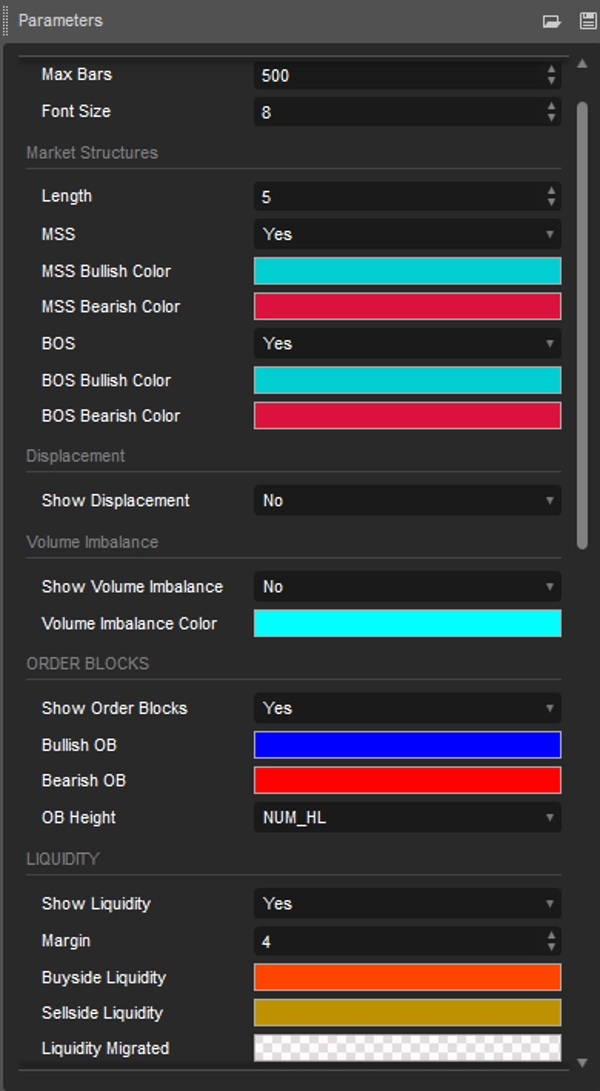
Tính năng tùy chỉnh
Người dùng có thể điều chỉnh các cài đặt như độ dài dữ liệu, màu sắc và kiểu hiển thị để phù hợp với sở thích giao dịch của họ.
Lợi ích cho nhà giao dịch
Tiết kiệm thời gian phân tích thủ công, nâng cao hiệu quả giao dịch.
Giúp đưa ra quyết định nhanh chóng và có thông tin trong điều kiện thị trường biến động.
Dễ sử dụng cho cả người mới bắt đầu và nhà giao dịch có kinh nghiệm.
Kết luận
Chỉ báo Simple ICT Concepts không chỉ là một công cụ mà còn là một giải pháp toàn diện cho các nhà giao dịch muốn triển khai hiệu quả các chiến lược ICT. Đây là một lựa chọn mạnh mẽ để nâng cao phân tích thị trường và thực hiện các giao dịch chính xác.
Tóm tắt
Tóm tắt AI
The Simple ICT Concepts Indicator is a technical analysis tool designed to assist traders in applying the Inner Circle Trader (ICT) methodology. It identifies key market zones including liquidity levels, support and resistance, and market structure to support price action and smart money concept trading. The indicator labels market structure shifts (MSS) and breaks of structure (BOS) based on swing point breaks, helping users determine current market trends. It detects displacements characterized by successive candles with strong directional sentiment, volume imbalances where candle bodies leave gaps, and order blocks representing institutional buy or sell zones. The tool highlights buy-side and sell-side liquidity levels, indicating where stop-loss and limit orders cluster. It also identifies fair value gaps (FVG), implied fair value gaps (IFVG), balanced price ranges, and new week/day opening gaps (NWOG/NDOG). Users can customize settings such as data length, colors, and display styles to fit their trading preferences. The indicator aims to save time on manual analysis and facilitate quick, informed decisions in volatile markets. It is suitable for both beginners and experienced traders seeking to implement ICT strategies effectively across markets including Forex, cryptocurrencies, and indices like BTCUSD, XAUUSD, and NAS100.
Hồ sơ chỉ báo
Đánh giá của khách hàng
4.0
Đánh giá: 1
5 | 0 % | |
4 | 100 % | |
3 | 0 % | |
2 | 0 % | |
1 | 0 % |
Đánh giá của khách hàng
December 27, 2025
The signal still needs a chart check, no surprise there. One green trade proves nothing.
Thảo luận
Câu hỏi thường gặp
BTCUSD
Forex
Signal
Fair Value Gap
Crypto
XAUUSD
NAS100
Các sản phẩm có sẵn trên cTrader Store, bao gồm bot giao dịch, chỉ báo và plugin, được cung cấp bởi các nhà phát triển bên thứ ba và chỉ nhằm mục đích cung cấp thông tin và tiếp cận kỹ thuật. cTrader Store không phải là nhà môi giới và không cung cấp lời khuyên đầu tư, khuyến nghị cá nhân hay bất kỳ đảm bảo nào về hiệu suất trong tương lai.


Giá
38
Lượt bán
2.39K
Cài đặt miễn phí