
Superior Trading Sessions Indicator cTrader
Индикатор
1 покупки
Версия 1.0, Jun 2026
Windows, Mac
Описание
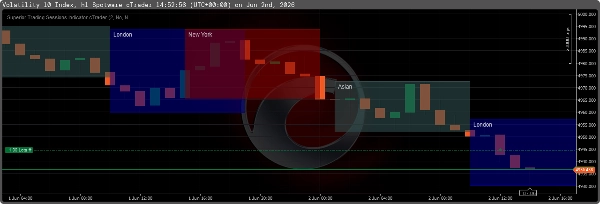
Индикатор Superior Trading Sessions — это чисто технический инструмент отображения, разработанный специально для cTrader. Он автоматически рассчитывает и визуализирует основные мировые торговые сессии (Азиатская, Лондонская, Нью-Йоркская, Франкфуртская) вместе со структурными элементами концепций Smart Money (SMC). Он предназначен для отслеживания ликвидных зон и структурных целей без загромождения ценового действия.
Основные визуализации
- Прямоугольники сессий: Отображает 4 основные торговые сессии и 4 специфические зоны высокой волатильности "Killzones" с регулируемой прозрачностью и четкими сплошными границами.
- Максимум/минимум предыдущего дня (PDH/PDL): Автоматически отображает максимальные и минимальные цены вчерашнего дня как структурные цели ликвидности для текущего торгового дня.
- Проекции азиатского диапазона: Продлевает горизонтальные линии от максимума и минимума Азии на 16 часов вперед, чтобы помочь выявить ликвидные прогоны во время пересечения Лондонской и Нью-Йоркской сессий.
- Эквилибриум сессии: Рисует 50% среднюю линию (эквилибриум) через активные сессии для объективного определения зон премии и скидки.
- Данные в реальном времени: Отображает размер пипса активной сессии в реальном времени вместе с точными метками максимума/минимума в углах прямоугольника сессии.
- Сокращение загромождения: Включает опцию полного скрытия всех исторических прямоугольников сессий, оставляя на графике только текущую активную сессию.
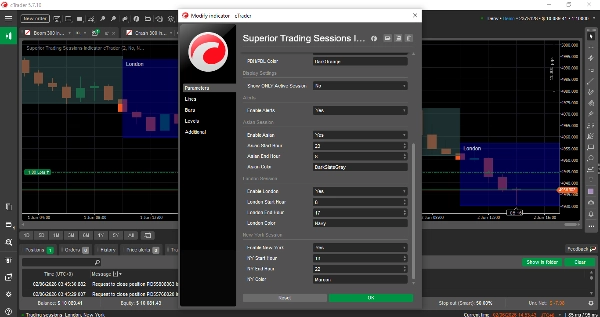
Объяснение входных параметров
Настройки часового пояса
- Смещение брокера GMT: (Целое число) Установите это значение в соответствии со смещением UTC/GMT вашего брокера. Это гарантирует точное совпадение стандартных часов сессий с серверным временем брокера.
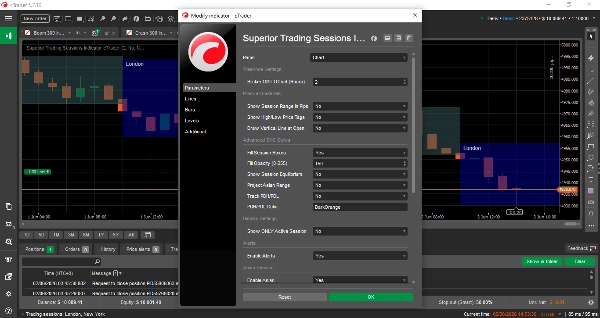
Премиум-функции
- Показывать диапазон сессии в пипсах: (True/False) Отображает общую высоту сессии в пипсах рядом с меткой названия сессии.
- Показывать метки максимума/минимума цены: (True/False) Выводит точный уровень цены в верхних и нижних правых углах прямоугольника сессии.
- Рисовать вертикальную линию на открытии: (True/False) Рисует вертикальную пунктирную линию точно на свече открытия сессии.
Расширенные стили SMC
- Заполнять прямоугольники сессий: (True/False) Если True, прямоугольник имеет затенённый фон. Если False, прямоугольник пустой (рисуется только рамка).
- Прозрачность заливки (0-255): Управляет прозрачностью заливки сессии. Низкие значения (например, 80) позволяют видеть свечи; высокие создают более тёмный, насыщенный фон.
- Показывать эквилибриум сессии: (True/False) Рисует пунктирную линию точно на уровне 50% отката сессии.
- Проецировать азиатский диапазон: (True/False) Проецирует горизонтальные трендовые линии от максимума и минимума Азии на остальную часть дня.
- Отслеживать PDH/PDL: (True/False) Рисует сплошные горизонтальные линии, отмечающие экстремумы предыдущего дня.
- Цвет PDH/PDL: Определяет цвет, используемый для линий дневной ликвидности.
Настройки отображения
- Показывать ТОЛЬКО активную сессию: (True/False) Если True, индикатор удаляет все исторические рисунки и отображает только текущую сессию.
Оповещения и уведомления
- Включить оповещения: (True/False) Воспроизводит встроенный звук дверного звонка cTrader в точную секунду начала новой сессии.
Время сессий
- Включить [Session]: Переключает видимость основной сессии.
- Часы начала/окончания [Session]: Время начала и окончания сессии по GMT.
- Цвет [Session]: Конкретный цвет, применяемый к прямоугольнику, тексту и линиям сессии.
Сводка
ИИ-сводка
The Superior Trading Sessions Indicator for cTrader is a technical charting tool that automatically maps major global trading sessions—Asian, London, New York, and Frankfurt—directly on your charts. It highlights key market periods known as "Killzones" with adjustable transparency and clear borders. The indicator plots previous day’s high and low prices as structural liquidity targets and extends Asian session range lines forward to assist in identifying liquidity sweeps during overlapping sessions.
It includes a session equilibrium line marking the 50% midpoint to help distinguish premium versus discount price zones. Real-time session pip ranges and exact high/low price labels are displayed for active sessions. Users can reduce chart clutter by showing only the current session’s data.
Configurable input parameters allow adjustment of broker GMT offset, session start/end times, colors, and display options such as filled or hollow session boxes, vertical lines at session open, and alert sounds at session start. Advanced Smart Money Concepts (SMC) features support tracking of liquidity pools and structural levels including previous day highs/lows and Asian range projections.
This indicator is designed to provide clear, structured visualization of key trading sessions and liquidity targets without obscuring price action, aiding traders in market timing and structural analysis.
Профиль индикатора
Категория индикатора
Структура рынка (SMC)
Тип вывода
Визуализация
Требования к данным
Тиковые данные
Только бары
Поддерживаемые сигналы
Диапазон открытия сессии
Отзывы покупателей
0.0
Отзывы: 0
Отзывы покупателей
У этого продукта еще нет отзывов. Уже попробовали его? Поделитесь впечатлениями!
Обсуждение
Частые вопросы
Fibonacci
Premium/Discount
Key Levels
BOS
Liquidity Sweep
Support & Resistance
Продукты, доступные в cTrader Store, включая торговых ботов, индикаторы и плагины, предоставляются сторонними разработчиками и доступны исключительно в информационных и технических целях. cTrader Store не является брокером и не предоставляет инвестиционные консультации, персональные рекомендации или какие-либо гарантии будущей доходности.


Цена
26
Продажи