
Mô tả
Cách tốt nhất để nghĩ về Chỉ số Tổng hợp khi áp dụng cho RSI là nghĩ về RSI như Windows 3.0 và Chỉ số Tổng hợp như Windows 10. Constance Brown đã phát hiện ra rằng RSI, mặc dù nó tạo ra và phát hiện các phân kỳ, không chính xác như nó có thể. Đây là một nghịch lý khi nói điều này nhưng RSI là một chỉ báo động lượng mà không có bất kỳ phép tính động lượng nào đi kèm. RSI bỏ lỡ một lượng lớn các chuyển động quan trọng và thậm chí tạo ra một số chuyển động xấu. Những gì Constance Brown làm với RSI là đưa một phép tính động lượng vào chính RSI. Chỉ số này loại bỏ các giới hạn phạm vi chuẩn hóa trong RSI. Điều này có nghĩa là nó không bị ràng buộc trong phạm vi 0-100.
RSI và Chỉ số Tổng hợp cùng nhau
Một trong những chiến lược mà Constance Brown sử dụng với Chỉ số Tổng hợp là so sánh Chỉ số Tổng hợp với RSI. Khi chúng ta tìm kiếm các phân kỳ, chúng ta tìm những thứ như phân kỳ tăng giá. Phân kỳ tăng giá xảy ra khi giá tạo ra các đỉnh cao hơn, nhưng bộ dao động lại cho thấy các đỉnh thấp hơn. Khi chúng ta sử dụng RSI và Chỉ số Tổng hợp cùng nhau, chúng ta coi RSI như một biểu đồ giá và Chỉ số Tổng hợp là bộ dao động.
Chỉ báo có một đường RSI chuẩn nội bộ để phát hiện phân kỳ, vì vậy công việc đã được làm sẵn cho bạn. Giao dịch các tín hiệu phân kỳ như bạn sẽ làm với bất kỳ bộ dao động nào khác.
Tính năng chính của Chỉ số Tổng hợp là đại diện cho động lượng với các tín hiệu vận hành rõ ràng. Vì vậy, khi RSI vào vùng mua quá mức hoặc bán quá mức, việc Chỉ số Tổng hợp cắt ngang các đường trung bình động của nó theo hướng ngược lại đại diện cho một tín hiệu giao dịch tốt, sau đó, kết hợp sự cộng sinh này của động lượng bộ dao động với hành động giá trên các mức hỗ trợ và kháng cự, bạn sẽ có một logic giao dịch rất thú vị và chiến thắng, cũng rất phù hợp để giao dịch với tiền điện tử.
Cách sử dụng
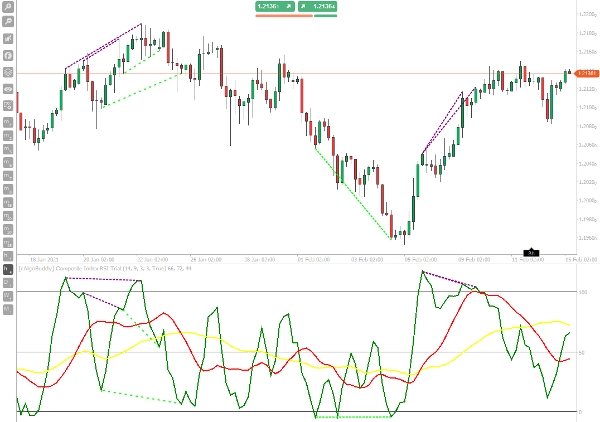
Chiến lược Chỉ số Tổng hợp là một chiến lược hành động giá động lượng dựa trên sự kết hợp của các mức hỗ trợ và kháng cự với các mức mua quá mức và bán quá mức của Chỉ số Sức mạnh Tương đối và Chỉ số Tổng hợp. Chỉ số Tổng hợp trong chiến lược giao dịch này cũng là thời điểm vào lệnh cuối cùng.
Khung thời gian: H1+, Luôn sử dụng cùng với RSI.
Mua
- Giá bật lên tại mức hỗ trợ.
- Các Đường Trung bình Động RSI Tổng hợp nằm dưới mức 50 và MA nhanh (Đỏ) thấp hơn MA chậm (vàng).
- RSI tạo đáy và giá trị gần hoặc dưới 30 và Chỉ số Tổng hợp cũng có đáy.
- Chúng ta vào lệnh mua ngay khi Chỉ số Tổng hợp cắt lên các đường trung bình động.
Bán
- Giá bật xuống tại mức kháng cự.
- Các Đường Trung bình Động Tổng hợp nằm trên mức 50 và MA nhanh (Đỏ) cao hơn MA chậm (vàng)
- RSI có đỉnh và giá trị gần hoặc trên 70 và Chỉ số Tổng hợp cũng có đỉnh.
- Chúng ta vào lệnh bán khi Chỉ số Tổng hợp cắt xuống các đường trung bình động (đây là thời điểm vào lệnh trên thị trường).
Tóm tắt
Đánh giá của khách hàng
5 | 0 % | |
4 | 100 % | |
3 | 0 % | |
2 | 0 % | |
1 | 0 % |


