
Mô tả
Bộ công cụ nến cuối cùng ở đây để giúp bạn phát hiện hầu hết các mẫu nến hiện có ngày nay.
Các mẫu nến, là công cụ giao dịch kỹ thuật, đã được sử dụng trong nhiều thế kỷ để dự đoán hướng giá. Có nhiều mẫu nến khác nhau được sử dụng để xác định hướng giá và động lượng, bao gồm ba đường strike, hai khoảng cách đỏ, ba con quạ đỏ, sao chiều tối và em bé bị bỏ rơi.
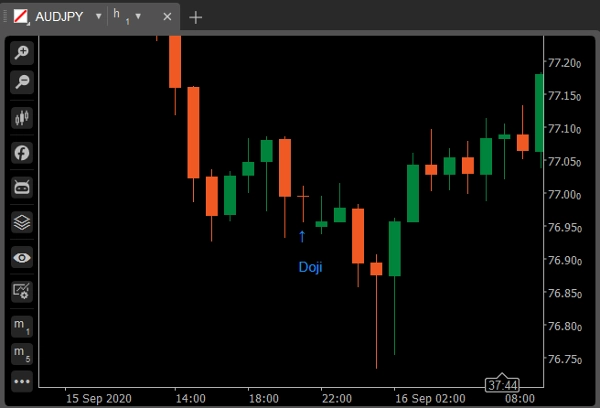
Doji
Một cây nến doji hình thành khi giá mở cửa và đóng cửa của một chứng khoán gần như bằng nhau trong khoảng thời gian nhất định và thường báo hiệu một mẫu đảo chiều cho các nhà phân tích kỹ thuật. Ngưỡng thân nến tối đa là 5% tổng chiều dài.
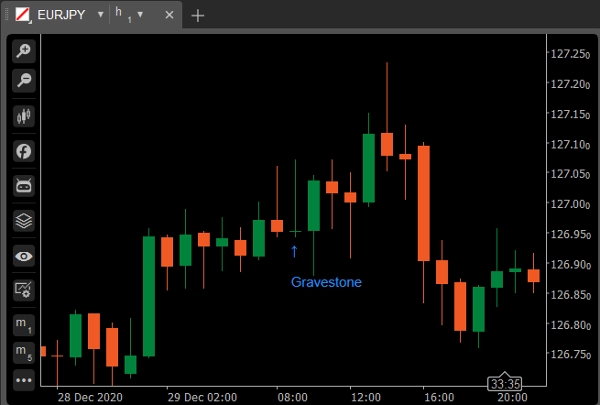
Biến thể: Doji Gravestone
Nó được hình thành khi giá cao, mở và đóng của tài sản gần như giống nhau. Bóng dưới dài cho thấy đã có sự bán mạnh trong khoảng thời gian của cây nến, nhưng vì giá đóng cửa gần với giá mở cửa nên cho thấy người mua đã hấp thụ được lượng bán và đẩy giá lên lại.
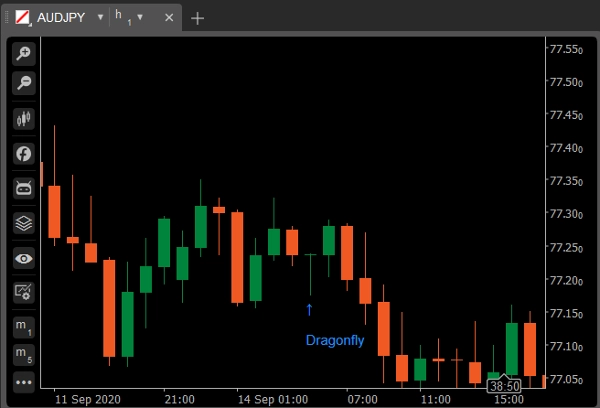
Biến thể: Doji Dragonfly
Một doji gravestone xảy ra khi giá thấp, mở và đóng gần như giống nhau, và cây nến có bóng trên dài. Doji gravestone trông giống như chữ "T" ngược. Ý nghĩa của doji gravestone giống với doji dragonfly. Cả hai đều chỉ ra khả năng đảo chiều xu hướng nhưng phải được xác nhận bởi cây nến tiếp theo.
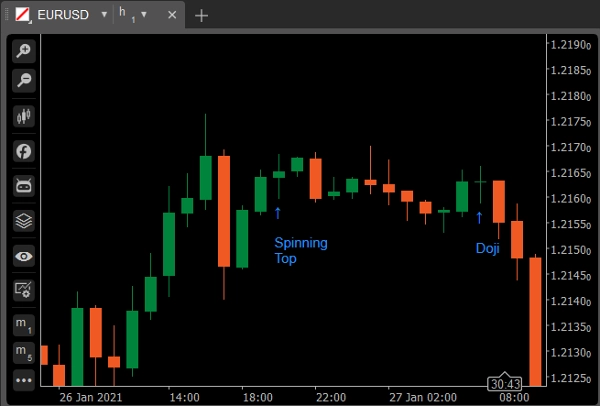
Spinning Top
Spinning top là một mẫu nến với thân thật ngắn nằm ở giữa bóng trên và bóng dưới dài. Mẫu nến này biểu thị sự do dự về hướng đi tương lai của tài sản. Cả người mua và người bán đều không chiếm ưu thế. Ngưỡng thân nến tối đa là 20% tổng chiều dài.
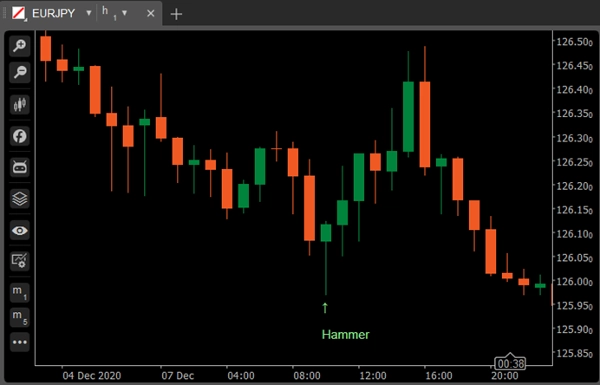
Hammer
Hammer là một cây nến xanh hoặc đỏ gồm thân nhỏ gần đỉnh với ít hoặc không có bóng trên và bóng dưới dài. Được coi là mẫu tăng trong xu hướng giảm.
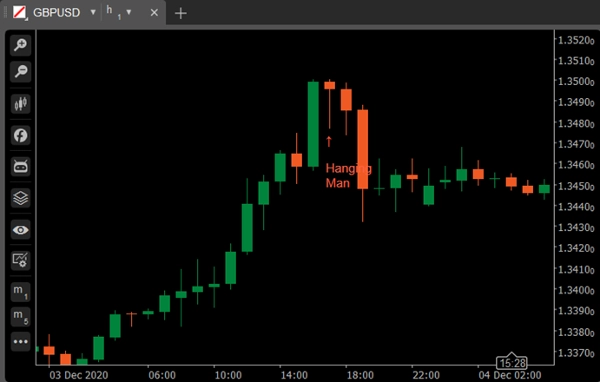
Biến thể: Hanging Man
Một cây nến xanh hoặc đỏ gồm thân nhỏ gần đỉnh với ít hoặc không có bóng trên và bóng dưới dài. Được coi là mẫu giảm trong xu hướng tăng.
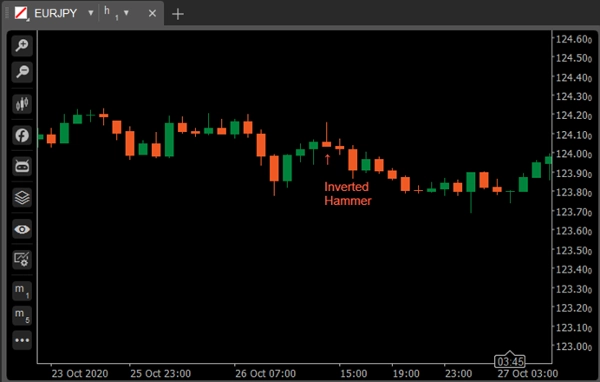
Inverted Hammer
Inverted hammer là một loại mẫu nến xuất hiện sau xu hướng giảm và thường được coi là tín hiệu đảo chiều xu hướng.
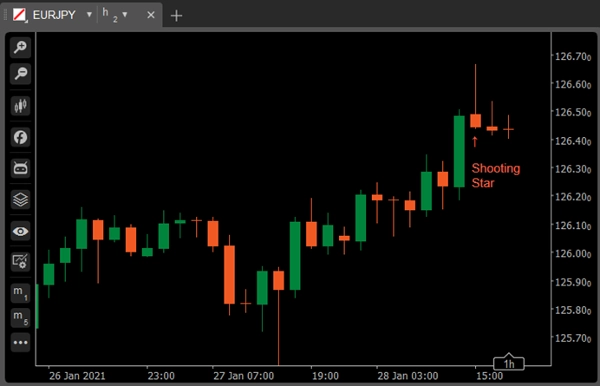
Biến thể: Shooting Star
Shooting Star trông giống hệt Inverted hammer, nhưng thay vì xuất hiện trong xu hướng giảm, nó xuất hiện trong xu hướng tăng và do đó có ý nghĩa khác.
Marubozu
Một cây nến dài hoặc bình thường (đỏ hoặc xanh) không có bóng hoặc đuôi. Giá cao và thấp đại diện cho giá mở và đóng. Được coi là mẫu tiếp diễn.
Biến thể: Marubozu Open
Đối với Marubozu open, giá mở cửa nên phẳng: tức là hành động giá chỉ di chuyển theo một hướng, nhưng không giống như Marubozu full candle, giá đóng cửa ở phía bên kia có thể hơi khác so với giá cao/thấp. Nói cách khác, giá mở cửa nên phẳng, trong khi có chỗ cho một bóng ngắn ở phía bên kia.
Biến thể: Marubozu Close
Cây nến Marubozu close ngược lại với Marubozu open: giá đóng cửa nên phẳng trong khi hành động giá có thể di chuyển nhẹ sang hướng khác trước khi bắt đầu giao dịch mạnh theo một hướng.
Bullish Engulfing
Bao gồm một thân nến đỏ nhỏ hơn nằm trong thân nến xanh lớn tiếp theo. Khi xuất hiện ở đáy, nó được hiểu là tín hiệu đảo chiều lớn.
Bearish Engulfing
Bao gồm một thân nến xanh nhỏ hơn nằm trong thân nến đỏ lớn tiếp theo. Khi xuất hiện ở đỉnh, nó được coi là tín hiệu đảo chiều lớn.
Piercing Line
Piercing Line bao gồm một cây nến đỏ theo sau là một cây nến xanh mở cửa thấp hơn đáy của cây nến trước nhưng đóng cửa vượt quá nửa thân nến đỏ. Nó được coi là tín hiệu đảo chiều khi xuất hiện ở đáy.
Dark Shadow Cover
Bao gồm một cây nến xanh dài theo sau là một cây nến đỏ mở cửa cao hơn đỉnh cây nến xanh và đóng cửa sâu trong thân nến xanh. Nó được coi là tín hiệu đảo chiều giảm trong xu hướng tăng.
Bullish Harami
Bao gồm một thân nến đỏ bất thường lớn theo sau là một thân nến xanh nhỏ (nằm trong thân nến đỏ lớn). Nó được coi là mẫu tăng khi đi kèm với xu hướng giảm trước đó.
Biến thể: Bullish Harami Cross
Một thân nến đỏ lớn theo sau là một Doji. Nó được coi là tín hiệu đảo chiều khi xuất hiện ở đáy.
Bearish Harami
Bearish Harami bao gồm một thân nến xanh bất thường lớn theo sau là một thân nến đỏ nhỏ (nằm trong thân nến xanh lớn). Nó được coi là mẫu giảm khi đi kèm với xu hướng tăng trước đó.
Biến thể: Bearish Harami Cross
Một thân nến xanh lớn theo sau là một Doji. Được coi là tín hiệu đảo chiều khi xuất hiện ở đỉnh.
Bullish/Bearish Kicker
Tín hiệu Bullish Kicker thường xuất hiện sau một tin tức bất ngờ lớn được công bố trước hoặc sau giờ thị trường. Có điều gì đó đột ngột xảy ra, gây ra sự thay đổi lớn trong tâm lý nhà đầu tư, và một sự đảo chiều chắc chắn sẽ xảy ra. Khoảng cách càng lớn giữa hai cây nến, tín hiệu càng quan trọng.
Morning/Evening Star
Bao gồm một cây nến thân xanh lớn theo sau là một cây nến thân nhỏ (đỏ hoặc xanh) có khoảng cách trên so với cây trước. Cây thứ ba là cây nến thân đỏ đóng cửa sâu trong thân nến xanh lớn. Nó được coi là tín hiệu đảo chiều khi xuất hiện ở mức đỉnh.
Biến thể: Abandoned Baby
Three Green Soldiers/Three Red Crows
Bao gồm ba cây nến xanh dài với giá đóng cửa liên tiếp cao hơn. Giá đóng cửa gần hoặc ở mức cao nhất. Khi xuất hiện ở đáy, nó được hiểu là tín hiệu đảo chiều đáy.
Bao gồm ba cây nến đỏ dài với giá đóng cửa liên tiếp thấp hơn. Giá đóng cửa gần hoặc ở mức thấp nhất. Khi xuất hiện ở đỉnh, nó được coi là tín hiệu đảo chiều đỉnh.
Three Line Strike
Three line strike là một nhóm tiếp diễn gồm ba cây nến theo hướng xu hướng, theo sau là một cây nến cuối cùng kéo giá trở lại điểm bắt đầu. Các nhà giao dịch sử dụng three line strike như một cơ hội để mua tại đáy xu hướng gần đây hoặc bán tại đỉnh gần đây.
Two Red Gapping
Mẫu tiếp diễn two red gapping giảm xuất hiện sau một đỉnh đáng chú ý trong xu hướng tăng, với khoảng cách giảm tạo ra hai cây nến đỏ có đáy thấp hơn. Mẫu này dự đoán sự giảm tiếp tục xuống các mức thấp hơn nữa.
Tóm tắt
Đánh giá của khách hàng
5 | 100 % | |
4 | 0 % | |
3 | 0 % | |
2 | 0 % | |
1 | 0 % |


