
Mô tả
Lệnh Cụm Thanh Khoản (LCO) 🔍💧
1. LCO hiển thị những gì
Lệnh Cụm Thanh Khoản tự động phát hiện và vẽ:
- Các cụm thanh khoản tăng giá (các vùng cầu / tích lũy tiềm năng) ✅
- Các cụm thanh khoản giảm giá (các vùng cung / phân phối tiềm năng) 🔻
Mỗi cụm là:
- được neo trên một thanh trục khối lượng (một cực đại cục bộ của khối lượng),
- được phân loại là tăng giá hoặc giảm giá dựa trên sự mở rộng giá gần đây,
- được kéo dài về phía trước theo thời gian cho đến khi giá giảm nhẹ (tiêu thụ) cụm.
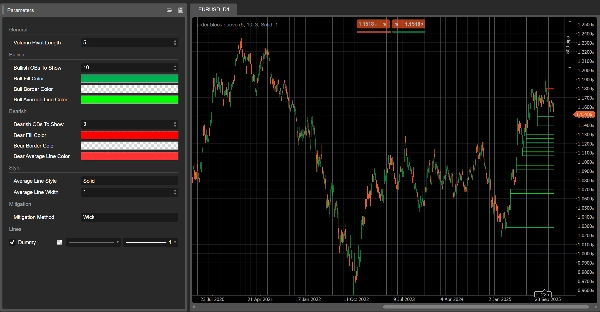
Trên biểu đồ bạn sẽ thấy:
- Hình chữ nhật màu xanh lá → các cụm thanh khoản tăng giá
- Hình chữ nhật màu đỏ → các cụm thanh khoản giảm giá
- Một đường màu xám bên trong mỗi hình chữ nhật → mức giá trung bình của cụm đó
Khi một cụm được coi là đã giảm nhẹ, nó biến mất khỏi biểu đồ và chỉ còn lại các cụm đang hoạt động.
2. Logic phát hiện (nói đơn giản)
- Thanh trục khối lượng
-
- LCO quét các thanh mà khối lượng cao hơn so với các thanh
Độ dài Thanh Trục Khối Lượngtrước và sau đó. - Những thanh này là thanh trục khối lượng – điểm neo tiềm năng cho các cụm thanh khoản.
- LCO quét các thanh mà khối lượng cao hơn so với các thanh
- Ngữ cảnh: tăng giá vs giảm giá
-
- Hành vi giá gần đây xác định một ngữ cảnh:
-
- Ngữ cảnh tăng giá → sự mở rộng xuống dưới đã chiếm ưu thế.
- Ngữ cảnh giảm giá → sự mở rộng lên trên đã chiếm ưu thế.
- Ngữ cảnh này quyết định liệu thanh trục khối lượng tiếp theo sẽ tạo ra một cụm thanh khoản tăng giá hay giảm giá.
- Cụm thanh khoản tăng giá
Trong một ngữ cảnh tăng giá: -
- Đáy cụm = đáy của thanh trục
- Đỉnh cụm = điểm giữa của thanh (
(cao + thấp) / 2) - Diễn giải: vùng nơi áp lực giảm giá đã được hấp thụ và người mua đã bước vào mạnh mẽ.
- Cụm thanh khoản giảm giá
Trong một ngữ cảnh giảm giá: -
- Đáy cụm = điểm giữa của thanh trục
- Đỉnh cụm = đỉnh của thanh trục
- Diễn giải: vùng nơi áp lực tăng giá đã được hấp thụ và người bán đã kiểm soát.
- Đường trung bình
-
- Đối với mỗi cụm, LCO tính trung bình của đỉnh & đáy và vẽ một đường giữa màu xám.
- Đường này đóng vai trò như một mức cân bằng nội bộ của cụm.
- Giảm nhẹ (tiêu thụ cụm)
Ở mỗi thanh mới, LCO kiểm tra xem một cụm có bị giảm nhẹ hay không: -
- Đối với các cụm tăng giá:
-
- Nó theo dõi một giá mục tiêu giảm trong
Độ dài Thanh Trục Khối Lượngthanh gần đây: -
Phương pháp giảm nhẹ = Wick→ mức thấp nhất.Phương pháp giảm nhẹ = Close→ mức đóng cửa thấp nhất.
- Nếu giá mục tiêu này đi xuống dưới đáy cụm, cụm tăng giá được coi là đã giảm nhẹ và bị loại bỏ.
- Nó theo dõi một giá mục tiêu giảm trong
- Đối với các cụm giảm giá:
-
- Nó theo dõi một giá mục tiêu tăng:
-
Wick→ mức cao nhất.Close→ mức đóng cửa cao nhất.
- Nếu giá mục tiêu này đi lên trên đỉnh cụm, cụm giảm giá được giảm nhẹ và bị loại bỏ.
Đã giảm nhẹ = thanh khoản trong cụm đó được cho là đã bị tiêu thụ / vô hiệu hóa.
3. Cách đọc LCO trên biểu đồ
Bạn sẽ thấy chủ yếu:
- Các cụm màu xanh lá bên dưới giá → các vùng thanh khoản cầu tiềm năng
- Các cụm màu đỏ bên trên giá → các vùng thanh khoản cung tiềm năng
Cách đọc điển hình (không phải lời khuyên giao dịch):
- Các cụm mới
-
- Các cụm mới tạo thường có liên quan hơn:
-
- Cụm tăng giá dưới giá → khu vực nơi người mua lần cuối hấp thụ áp lực bán.
- Cụm giảm giá trên giá → khu vực nơi người bán lần cuối hấp thụ áp lực mua.
- Kiểm tra lại cụm
-
- Giá quay lại một cụm tăng giá từ phía trên:
-
- Nếu giá phản ứng và giữ đáy → có thể là vùng bật lên / phản ứng mua.
- Giá quay lại một cụm giảm giá từ phía dưới:
-
- Nếu giá không thể giao dịch trên đỉnh → có thể là vùng từ chối / phản ứng bán.
- Cụm đã giảm nhẹ vs cụm đang hoạt động
-
- Khi giá cắt qua một cụm vượt quá giới hạn của nó theo phương pháp giảm nhẹ đã chọn,
→ cụm thanh khoản đó sẽ bị loại bỏ trên các thanh tiếp theo. - Các cụm vẫn hiển thị là vùng thanh khoản hoạt động chưa bị giao dịch hết.
- Khi giá cắt qua một cụm vượt quá giới hạn của nó theo phương pháp giảm nhẹ đã chọn,
- Sử dụng đường giữa
-
- Đường giữa màu xám đó có thể được sử dụng như:
-
- mức chốt lời hoặc thoát một phần bên trong cụm,
- một tham chiếu “giá hợp lý” trong vùng thanh khoản,
- cách nhanh để xem giá đang giao dịch ở nửa trên hay nửa dưới của cụm.
4. Tham số (Tiếng Anh)
Độ dài Thanh Trục Khối Lượng
- Các thanh được sử dụng để:
-
- phát hiện thanh trục khối lượng,
- tính toán các cực trị và mục tiêu giảm nhẹ.
- Giá trị thấp hơn → nhiều cụm hơn, nhiều nhiễu hơn;
- Giá trị cao hơn → ít cụm hơn, cụm quan trọng hơn.
Số lượng Cụm Thanh Khoản Tăng Giá Hiển Thị
(trước đây là Số lượng OB Tăng Giá Hiển Thị)
- Số lượng tối đa cụm tăng giá được hiển thị trên biểu đồ.
Số lượng Cụm Thanh Khoản Giảm Giá Hiển Thị
(trước đây là Số lượng OB Giảm Giá Hiển Thị)
- Số lượng tối đa cụm giảm giá được hiển thị.
Màu nền Cụm Tăng / Màu nền Cụm Giảm
- Màu nền của các cụm tăng/giảm giá.
- Bạn có thể bao gồm giá trị alpha (độ mờ).
Màu Đường Trung Bình Tăng/Giảm
- Màu của đường giữa nội bộ cho mỗi cụm.
Kiểu Đường Trung Bình
- Kiểu hiển thị cho đường giữa:
"Solid","Dashed","Dotted".
Độ Dày Đường Trung Bình
- Độ dày của đường giữa.
Phương Pháp Giảm Nhẹ
"Wick"→ giảm nhẹ dựa trên đỉnh/đáy bóng nến (nhạy cảm hơn)."Close"→ giảm nhẹ dựa trên giá đóng cửa (thận trọng hơn).
Tóm tắt
On the chart, bullish clusters appear as green rectangles below the price, indicating areas where buyers absorbed selling pressure. Bearish clusters are shown as red rectangles above the price, marking zones where sellers absorbed buying pressure. Each cluster includes a grey mid-line representing the average price level, serving as an internal equilibrium reference.
Clusters extend forward in time until price "mitigates" or consumes them, at which point they disappear, leaving only active liquidity zones visible. Mitigation is determined by tracking price extremes (high/low wicks or closing prices) over a configurable number of bars.
Key parameters include the volume pivot length (defining sensitivity and cluster significance), maximum clusters displayed, cluster colors, mid-line style, and mitigation method. LCO supports various markets including forex, indices, commodities, stocks, and cryptocurrencies, and integrates with multiple trading strategies and indicators such as RSI, MACD, Bollinger Bands, and Fibonacci levels.
Đánh giá của khách hàng
5 | 100 % | |
4 | 0 % | |
3 | 0 % | |
2 | 0 % | |
1 | 0 % |


