
Mô tả
Bộ công cụ Hỗ trợ & Kháng cự là một chỉ báo phân tích cấu trúc thị trường toàn diện được thiết kế để giúp các nhà giao dịch xác định các vùng hỗ trợ và kháng cự có xác suất cao trên biểu đồ. Bằng cách kết hợp nhiều thuật toán phát hiện điểm xoay nâng cao với các vùng biến động thích ứng, bộ lọc dòng tiền tổ chức và phân tích thanh khoản, bộ công cụ này biến các đường hỗ trợ và kháng cự truyền thống thành một công cụ chiến lược dựa trên dữ liệu.
Phát hiện
Bộ công cụ này bao gồm bốn phương pháp phát hiện nâng cao được thiết kế phù hợp với các phong cách giao dịch và môi trường thị trường khác nhau:
- Pivots: Phương pháp phát hiện hỗ trợ và kháng cự cổ điển sử dụng độ mạnh nhìn lại bên trái và bên phải có thể cấu hình để phát hiện các đỉnh và đáy cục bộ.
- Donchian: Một thuật toán máy trạng thái hiệu suất cao phát hiện các cấu trúc dao động luân phiên. Thay vì sử dụng độ trễ cố định, nó xác nhận các cực trị khi thị trường thay đổi trạng thái hướng.
- CSID: Một phương pháp phát hiện dựa trên động lượng xác định các điểm quay cấu trúc dựa trên các cây nến tăng hoặc giảm liên tiếp, làm nổi bật các vùng khởi đầu xu hướng mạnh.
- ZigZag: Một thuật toán dựa trên biến động lọc các biến động giá nhỏ bằng cách yêu cầu một độ lệch phần trăm tối thiểu trước khi xác định một dao động.
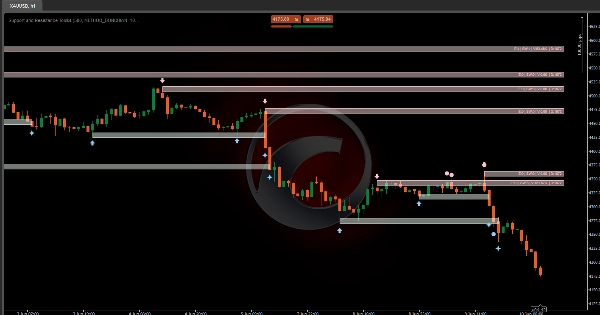
Vùng / Mức
Không giống như các chỉ báo thông thường chỉ vẽ các đường cố định, công cụ này coi các mức hỗ trợ và kháng cự như các vùng giá động dựa trên các đặc điểm sau:
- Độ sâu vùng (Nhân ATR): Xác định độ dày của mỗi vùng dựa trên Khoảng Biến Động Trung Bình Thực (Average True Range). Điều này cho phép các vùng tự động điều chỉnh theo biến động thị trường.
- Đệm Phá vỡ (Nhân ATR): Một lớp đệm bảo mật độc đáo mở rộng vùng vượt ra ngoài phía phá vỡ. Giá phải di chuyển vượt qua lớp biến động bổ sung này trước khi chỉ báo xác nhận một đợt phá vỡ, giảm các tín hiệu sai và các cú giả phá vỡ.
Lọc & Hiển thị:
- Hợp nhất vùng chồng lấp: Kết hợp các vùng giao nhau thành một “Siêu Vùng” lớn hơn đại diện cho phạm vi tương tác lịch sử đầy đủ.
- Ẩn vùng cũ nhất trước: Ưu tiên cấu trúc thị trường gần đây bằng cách ẩn các vùng cũ hơn khi xảy ra chồng lấp.
- Ẩn vùng trẻ nhất trước: Bảo tồn các cấu trúc lịch sử đã thiết lập bằng cách bỏ qua các vùng mới nhỏ hơn xuất hiện trong phạm vi hiện có.
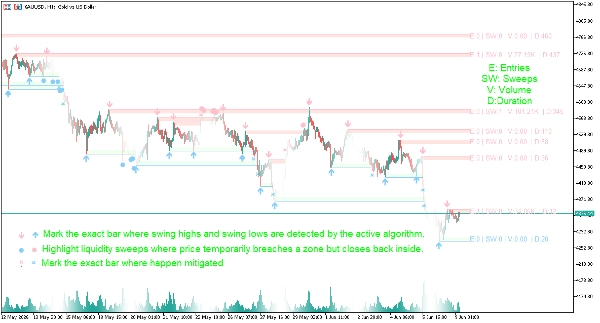
Lọc mức ( E: Lượt vào | S: Độ mạnh | SW: Quét | V: Khối lượng | D: Thời lượng )
- Lượt vào giá (E): Yêu cầu một mức được kiểm tra lại một số lần nhất định trước khi xuất hiện trên biểu đồ.
- Quét (SW): Phát hiện bẫy thanh khoản nơi giá tạm thời vi phạm một mức với bóng nến nhưng đóng cửa lại bên trong vùng.
- Khối lượng giao dịch (V): Theo dõi tổng khối lượng giao dịch xảy ra khi giá tương tác với vùng, làm nổi bật sự tham gia của tổ chức.
- Thời lượng (D): Yêu cầu các vùng tồn tại tối thiểu một số thanh trước khi được coi là các mức cấu trúc hợp lệ.
Tín hiệu trực quan
- Mũi tên ⬆/⬇: Đánh dấu chính xác thanh nơi các đỉnh và đáy dao động được thuật toán đang hoạt động phát hiện.
- ● Chấm lớn: Làm nổi bật các lần quét thanh khoản nơi giá tạm thời vượt qua vùng nhưng đóng cửa lại bên trong.
- ✖ Dấu chéo: Đánh dấu chính xác thanh nơi các đỉnh và đáy dao động bị di chuyển.
- Nhãn tóm tắt: Mỗi khu vực hiển thị có một nhãn dữ liệu ngắn gọn bao gồm các tham số E (Lượt vào), S (Độ mạnh), SW (Quét), V (Khối lượng) và D (Thời lượng), cho phép người dùng nhanh chóng đánh giá chất lượng cấu trúc.
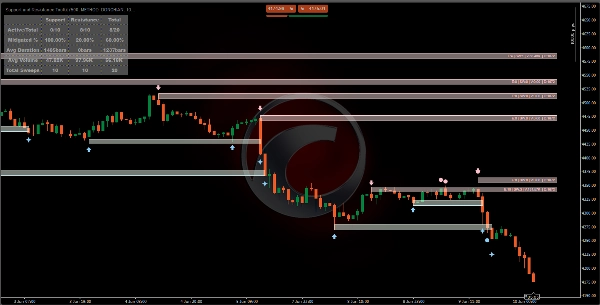
Bảng điều khiển
- Hoạt động / Tổng số: Hiển thị số cấu trúc hiện đang hoạt động so với tổng số được phát hiện trong lịch sử.
- Phần trăm giảm thiểu: Đo lường tần suất các mức bị phá vỡ hoặc giảm thiểu, cung cấp cái nhìn sâu sắc về độ tin cậy của cấu trúc thị trường.
- Thời lượng trung bình: Số thanh trung bình mà một vùng hỗ trợ hoặc kháng cự tồn tại trước khi bị phá vỡ.
- Khối lượng trung bình: Chỉ ra sự tham gia trung bình của tổ chức trong các vùng trước khi xảy ra phá vỡ.
- Tổng số lần quét: Theo dõi hành vi săn thanh khoản trên toàn thị trường.
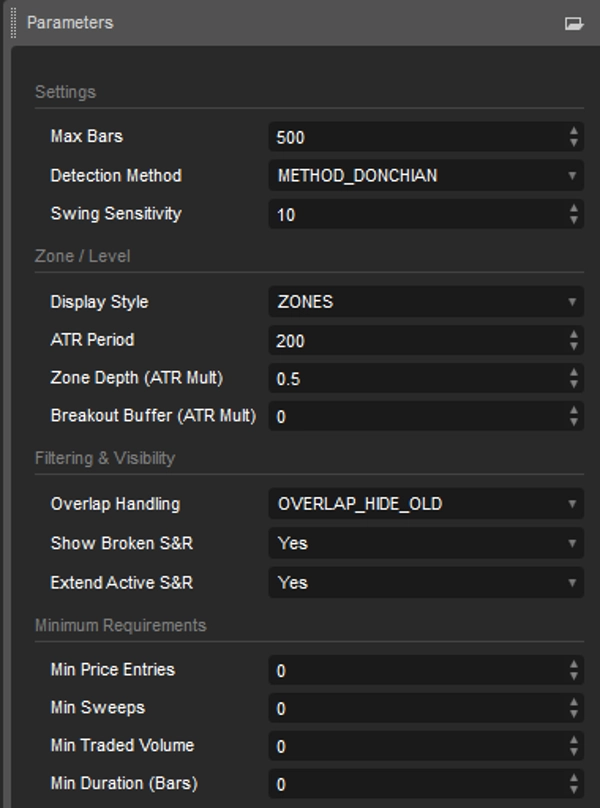
Cài đặt chỉ báo
Cài đặt phát hiện
- Phương pháp phát hiện: Chọn giữa các logic phát hiện dao động Pivots, Donchian, CSID hoặc ZigZag.
- Độ nhạy dao động: Điều chỉnh độ lệch hoặc độ dài nhìn lại cần thiết để xác nhận các đỉnh và đáy dao động.
Cấu hình vùng & mức
- Kiểu hiển thị: Chuyển đổi giữa các đường hỗ trợ và kháng cự ngang chính xác hoặc các vùng dựa trên ATR.
- Chu kỳ ATR: Xác định chu kỳ biến động được sử dụng cho các phép tính vùng.
- Độ sâu vùng (Nhân ATR): Điều chỉnh độ dày của các vùng hỗ trợ và kháng cự.
- Đệm Phá vỡ (Nhân ATR): Thêm lớp đệm biến động để lọc các đợt phá vỡ giả.
Hiển thị biểu đồ & Kiểm soát cấu trúc
- Xử lý chồng lấp: Chọn cách xử lý các vùng chồng lấp (Hợp nhất, Ẩn vùng cũ nhất, hoặc Ẩn vùng trẻ nhất).
- Tối đa hoạt động (Chưa giảm thiểu): Giới hạn số lượng vùng hỗ trợ và kháng cự đang hoạt động hiển thị trên biểu đồ.
- Hiển thị S&R bị phá vỡ: Bật/tắt việc các mức bị phá vỡ vẫn hiển thị để phân tích lịch sử.
- Mở rộng S&R hoạt động: Chiếu các mức đang hoạt động vào các thanh giá tương lai.
Yêu cầu cấu trúc tối thiểu
- Số lượt vào tối thiểu: Đặt số lần kiểm tra lại cần thiết trước khi một mức trở nên hiển thị.
- Số lần quét tối thiểu: Yêu cầu một số lần quét thanh khoản nhất định trước khi hiển thị vùng.
- Khối lượng giao dịch tối thiểu: Đảm bảo các vùng đáp ứng ngưỡng tham gia tổ chức tối thiểu.
- Thời lượng tối thiểu (Số thanh): Yêu cầu các mức tồn tại trong một số thanh nhất định trước khi xuất hiện.
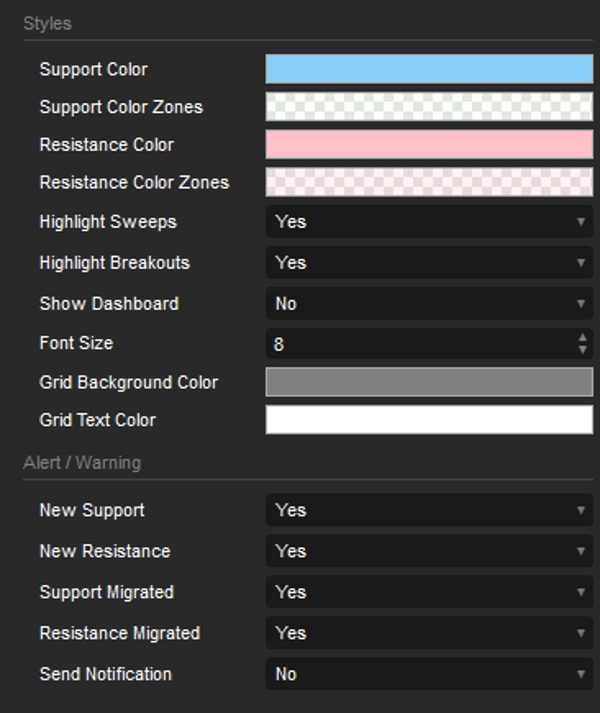
Kiểu dáng và Cảnh báo
- Kiểu dáng: Điều chỉnh cấu hình màu sắc đối tượng. Ẩn/Hiện Bảng điều khiển.
- Cảnh báo: Bật/tắt cảnh báo mỗi khi phát hiện S&R mới hoặc S&R bị di chuyển.
Tóm tắt
Unlike traditional fixed lines, this tool defines support and resistance as dynamic price zones, with thickness and breakout buffers scaled by Average True Range (ATR) to adapt to market volatility. It features zone merging and selective visibility options to manage overlapping zones, prioritizing recent or historical structures as needed.
The indicator applies multiple filters based on price re-tests, liquidity sweeps, traded volume, and zone duration to validate structural levels. Visual signals include arrows marking swing points, dots highlighting liquidity sweeps, crosses for migrated swings, and summary labels displaying entries, strength, sweeps, volume, and duration metrics.
A dashboard provides real-time statistics on active versus total structures, mitigation percentages, average zone duration, volume, and liquidity sweep counts. Users can customize detection methods, sensitivity, zone display styles, ATR parameters, overlap handling, and structural requirements. Alerts can be enabled for new or migrated support and resistance levels.
This toolkit supports detailed market structure analysis with data-driven, volatility-adjusted zones to assist traders in identifying key price areas.


