
Penerangan
Penunjuk Amaran Fibonacci
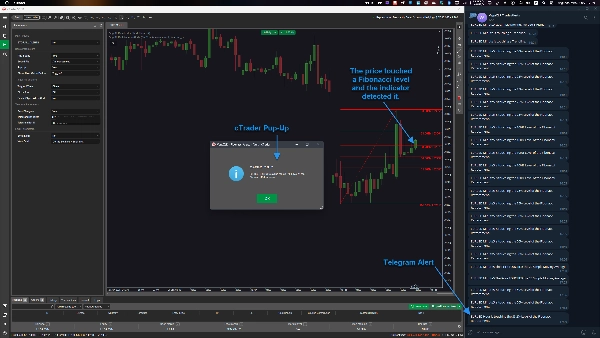
Penunjuk ini memberitahu anda apabila harga mencapai Fibonacci Retracements dan Expansions pada carta anda. Anda boleh menambah komen pada objek Fibonacci, dan ini akan muncul dalam amaran—membantu anda kekal teratur dengan idea perdagangan anda.
Anda mempunyai kawalan penuh ke atas bagaimana amaran dihantar, dengan pilihan untuk pemberitahuan bunyi, mesej pop-up, mesej Telegram, dan emel. Amaran boleh dicetuskan serta-merta apabila harga menyentuh tahap atau hanya selepas bar ditutup, berdasarkan harga bida atau tanya.
Dengan alat ini, anda tidak perlu lagi memantau carta secara berterusan—cuma tunggu amaran dan bertindak berdasarkan strategi anda.
Ciri-ciri:
✔ Amaran masa nyata apabila harga menyentuh tahap Fibonacci
✔ Pelbagai jenis amaran: Telegram, emel, mesej pop-up, dan pemberitahuan bunyi
✔ Amaran bunyi terbina dalam cTrader (tidak memerlukan fail luaran)
✔ Sistem pop-up tersuai untuk pemberitahuan yang lebih baik
✔ Tiada keperluan hak akses tinggi untuk menjalankan penunjuk
✔ Pilihan hentikan semua amaran untuk kawalan pantas
✔ Cetuskan amaran apabila bar ditutup atau serta-merta apabila disentuh
✔ Pilihan untuk mencetuskan amaran berdasarkan harga bida atau tanya
✔ Padam automatik objek Fibonacci selepas amaran (pilihan)
✔ Menyokong pelbagai objek Fibonacci (tanpa had)
✔ Tambah komen pada objek Fibonacci yang muncul dalam amaran
✔ Berfungsi pada mana-mana simbol dan jangka masa dalam cTrader
✔ Panduan pengguna terintegrasi boleh diakses melalui butang kecil pada carta
Ini adalah alat yang mudah tetapi berkuasa yang membantu anda berdagang dengan lebih cekap dengan mengautomasikan amaran tahap Fibonacci.
Nota: Penunjuk ini tidak melukis objek Fibonacci secara automatik. Ia mengesan dan berfungsi dengan objek Fibonacci yang anda letakkan secara manual pada carta.
Ringkasan
Ulasan pelanggan
5 | 50 % | |
4 | 50 % | |
3 | 0 % | |
2 | 0 % | |
1 | 0 % |


![Logo "Smart Money Concepts (SMC) [Iridio Capital]"](https://cdn.ctrader.com/image/webp/28b69fd1-ef54-4bed-9487-07e78e883be4_40934)


