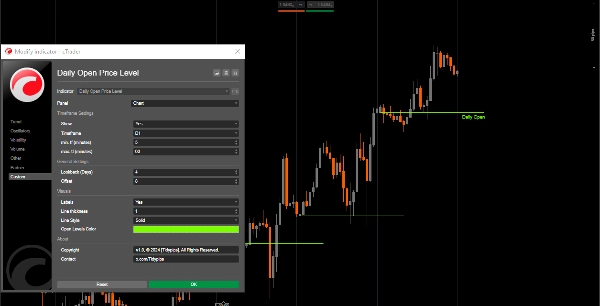
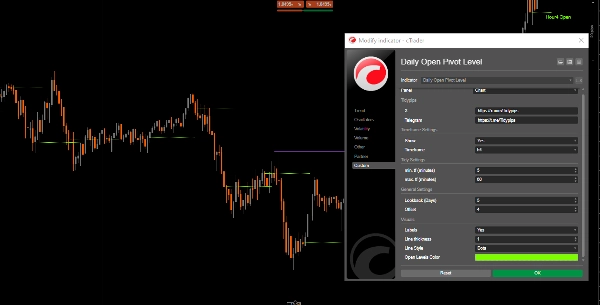
الوسطاء وشركات پروپ
للأعمال
00
Days
:
00
Hours
:
00
Minutes
:
00
Seconds
Daily Open Pivot Level
شعار "Daily Open Pivot Level"
منذ 19/11/2024
المبيعات
15
التثبيتات المجانية
3410
صورة "Daily Open Pivot Level" المحملةصورة "Daily Open Pivot Level" المحملةصورة "Daily Open Pivot Level" المحملةصورة "Daily Open Pivot Level" المحملةصورة "Daily Open Pivot Level" المحملة

#### Features

- **Customizable Timeframe**: Users can select a specific timeframe (e.g., daily) to analyze opening levels. Dont set any TF < 1H.

- **Lookback Period**: The indicator supports a lookback period, enabling traders to focus on recent price action and identify relevant points of interest.

- **Dynamic Trendlines**: It draws trendlines to indicate the opening price of the selected timeframe, providing clear visual cues for potential support and resistance levels.

- **Labeling Options**: Traders can enable labels to display the opening price directly on the chart, enhancing clarity and understanding.

- **Visual Customization**: Users can customize line colors, styles, and thicknesses to suit their preferences and improve chart readability.

- **Timeframe Restrictions**: The indicator includes checks to ensure it operates only within specified minimum and maximum timeframe settings, preventing misleading signals.


#### Tutorial

1. **Setup**: Open the indicator settings to select your desired timeframe, lookback period, and customize visual parameters like line color and thickness.

2. **Using the Indicator**: Once applied, the indicator will automatically plot the opening price levels on your chart based on the specified settings.

3. **Analyze**: Observe the plotted levels as you trade. Use these levels to identify potential support and resistance zones, and make informed trading decisions.


#### Recommended Companion Tools

- **cTrader**: The native platform for cAlgo, providing a seamless experience for using and customizing indicators.

- **Technical Analysis Tools**: Combine this indicator with other tools like moving averages or oscillators to enhance your trading strategy and market analysis.

- **Risk Management Tools**: Utilize position size calculators and stop-loss tools to effectively manage risk while trading around the identified opening levels.


By integrating the Daily Open Pivot Level Indicator with these tools, traders can enhance their market analysis and improve their chances of success in navigating the complexities of intraday trading.

0.0
التقييمات: 0
تقييمات العملاء
لا توجد تقييمات لهذا المنتج حتى الآن. هل جرَّبته بالفعل؟ كن أول من يخبر الآخرين!
المزيد من هذا المؤلف
ICT Killzone and Sessions high_low
This indicator is an essential tool for traders seeking to visualize key trading sessions on their charts.
مؤشر
XAUUSD
Commodities
FVG_tidypips
A Fair Value Gap (FVG) indicator that identifies potential price imbalances, potential reversal and continuation zones
Previous Day Liquidity Zones (PDH - PDL)
Useful indicator for traders who want to visualize key price levels based on previous daily highs and lows.
مؤشر
XAUUSD
Commodities
True Open Pivot Levels
This indicatorFull Description: Th shows the open price lines at key market times based on Eastern Standard Time (EST).
Moving Average channel
This indicator is designed to display customizable moving averages (MAs) on a chart.
Previous Day Equilibrium (Premium & Discount)
Plots the equilibrium price levels based on previous daily highs and lows.
Drawing Utility
A rectangular box with 5 adjustable Fibonacci level or even custom ones.
قد يعجبك أيضًا
مؤشر
Scalping
Grafico Diario
Bússola para Decisões de Trading Precisas e Eficientes!
مؤشر
Indices
Prop
Stocks
+5
ElliottWave
Elliott Wave Structure Pro v2.0 (Non-Repainting) Structure, Elliott, Continuation Entries
مؤشر
Breakout
Scalping
KAMAKeltner
KAMA Keltner – Adaptive Volatility Channel for Precision Trading
مؤشر
Breakout
AutoLines™ Support & Resistance
FlexSR auto‑detects pivot highs/lows to plot dynamic support & resistance lines Features customizable styling and option
مؤشر
NAS100
NZDUSD
XAUUSD
+13
FVGMTF
FVG Multi Time Frame Indicator
مؤشر
NAS100
NZDUSD
Martingale
+26
Info Dashboard_noSourceCode
Read the market with AI: live sentiment, news impact, equity, spread & neural net signals in one dashboard.
مؤشر
Indices
RSI
Commodities
+1
OrderPrice-V3
A straightforward yet effective tool signals entry points for both buying and selling. Include 3 Moving Average
مؤشر
Indices
Commodities
Forex
+1
HTF Candle
HTF Candle
مؤشر
Indices
Prop
Stocks
+3
Levels
Price Action Zone shows previous D/W/M key levels to help frame intraday price action, liquidity, and market structure.
مؤشر
RSI
Signal
MACD
+1
Long Wick
Identify potential reversal points in the market by detecting candles with exceptionally long upper or lower wicks
Volume Efficiency Analyzer
Analyzes volume efficiency and market quality. Measures effort vs result to identify decisive or exhausted moves.
مشهور
$ 15
مؤشر
Indices
ATR
Stocks
+4
UT Bot Alert
A powerful ATR-based indicator generating clear BUY/SELL signals. Features real-time alerts and customizable sensitivity
Trend Direction Force Index - TDFI (Alerts)
Spot Strong Trends Early & Filter Market Noise
Fibonacci Pitchfan
Powerful all-in-one tool for traders seeking a clear, dynamic view of market structure. By merging pivots, trendlines &
Cumulative Delta_noSourceCode
Demo of my main indcator.
مؤشر
FVG
Forex
Volume Profile Price
Volume Profile Price Period and Live VAH,VAL,POC,
مؤشر
NAS100
Indices
XAUUSD
+6
TRWatermark_v1.0
Customizable corner watermark — display symbol, timeframe, broker, or a live candle countdown without cluttering chart
مؤشر
NAS100
NZDUSD
Martingale
+25
Liquidity Cluster Order
Liquidity Cluster Order automatically detects and draws accumulation zones & distribution zones